3:30 p.m. New York time
The S&P 500 E-mini futures rose to a higher high today, 3382.50. In my analysis from this morning, that becomes the (possible) end of Primary wave 2. That level is 15 points below the beginning of Primary wave 1, from 3397.50 on February 19.
11:20 a.m. New York time
I’m dropping “Live:” from the title. Going forward, if the title is a date, it’s a live analysis of today’s market. If it has a symbol and “Analysis”, then I’m analyzing a trade. If it’s something else, then I’m talking theory or some other market topic.
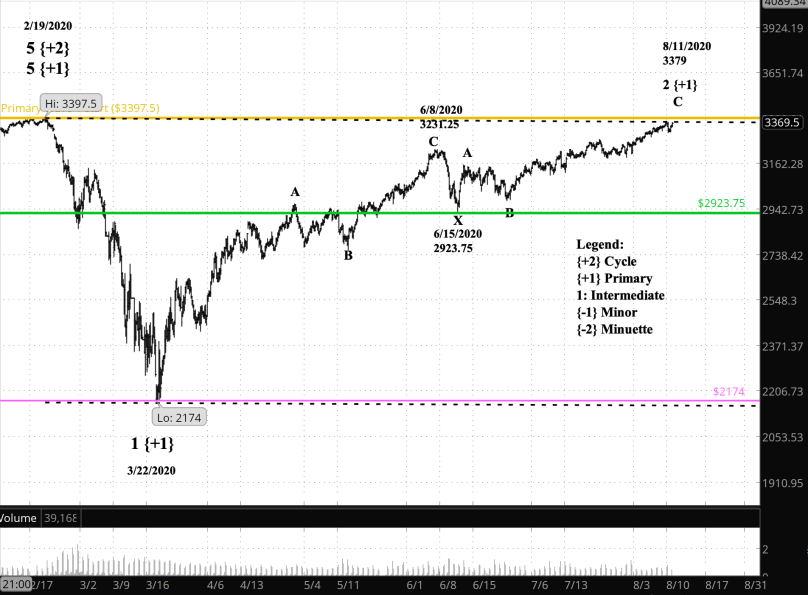
What’s happening now? The S&P 500 E-mini futures on Tuesday came within 18.5 points of the pre-crash peak (gold line) on February 19, then pulled back, and then rose again to 21.25 points below the peak. That’s the small hook on the far right.
What does it mean? Tuesday’s high, 3379, may well be the end of the upward correction that began on March 22 from 2174, and I’ve marked the chart on the assumption that the large-scale decline eventually reaching the 2100s has begun.
What does Elliott wave theory say? The trend channel links the February 19 peak and Tuesday’s high, or the start of downtrending Primary wave 1 and of Primary wave 3 (which is also the end of the uptrending Primary wave 2 correction).
The height attained by Primary wave 2 means that Primary 3 will be somewhat shallow as 3rd waves go. The price will certainly make it below the start of Primary wave 2, at 2174, but not dramatically below unless it stretches out for a great deal of time.
The stats:
- Primary wave 1, beginning February 19 at 3397.50, lasted for 32 days and declined by 1,223.50 points, or 36.0%.
- Primary wave 2, beginning March 22 at 2174, lasted for 142 days and rose by 1,205 points, or 55.4%.
Compare that record to the primary waves within Cycle wave 5, which began in 1974 and ended last February. The major trend was up, unlike our present Cycle wave 1, which began in February and is downtrending.
- Primary wave 1, beginning December 9, 1974, lasted for 12.7 years and rose by 2176.85 points, or 381.9%.
- Primary wave 2, beginning August 25, 1987, lasted for 56 days and declined by 1130.64, or 41.2%
- Primary wave 3, beginning October 20, 1987, lasted for 20 years and rose by 12581.59, or 778.5%
Clearly, the pre-2020 movements were orders of magnitude greater than the movements we’ve experienced since the February 19th crash, both in price and time.
It could be that my labeling of the chart is off by several degrees, although my labeling is in agreement with what the top analytical house eventually settled on. It could be that the velocity of the information flow, which drives the Zeitgeist and ultimately the trading decisions that drive the market, is so much greater now that market movements happen more quickly but are more quickly brought to halt by new information.
It’s a mystery. And as a trader, the best I can do at this point is to track the waves and trade as they dictate based on their relative positioning, regardless of the formal labeling of the degree.
What is the alternative? If the price moves above 3397.50, the start of Primary wave 1, then the Cycle wave 5 rise that began in 1974 is still underway, and what we’ve experienced since February has been a minor stumble in the market’s upward path.
What about my trades? Assuming that Primary wave 3 has begun, when should I re-enter?
Shares are easy; they never expire and time tends to heal all errors in market analysis. I’ll resume entering positions on shares of SDS, which moves the opposite of the S&P 500.
Options are trickier, because I’ve got to hit the trend precisely to avoid losses. Entry here depends upon the internal structure of Primary wave 3. And Elliott wave analysis tells us what that will be.
The first wave will carry the price down, perhaps lower than the beginning of the last X wave on June 15 at 2923.5 (green line). That point marks the beginning of the final (?) three wave movement of Intermediate degree within Primary wave 2.
But then comes Intermediate wave 2 within Primary 3, an upward correction that typically will come quite close to where we are today. It can’t move above the start of Primary wave 1, at 3379, but it can come close.
After Intermediate 2 has completed its work, then Intermediate wave 3 will move the price significantly, and that’s the wave to catch for options trades.
Elliotticians says that the best waves for trading are waves 3 and 5, and waves A and C. So for options, I think Intermediate wave 1 is a pass.
Learning and other resources. Elliott Wave International has long been the leading analytical house based on Elliott wave theory. They make available a number of free educational materials and other resources, in addition to their for-pay subscriptions.
I recommend two books, both by people associated with EWI.
First, Elliott Wave Principle by Robert Prechter and A.J. Frost is the book that, along with Prechter’s analyses, that created the revival of Elliott wave theory. I first read it in 1984, and it has had a profound influenced on my thinking about markets ever since.
Second, I’ve found Visual Guide to Elliott Wave Trading by Wayne Gorman and Jeffrey Kennedy, both of EWI, to be a useful book that relates Elliott wave theory to practical trading. The authors are hands-on Elliotticians, and for an active trader, that’s exactly what’s needed — less theory and more how-to. The first chapter of the book gives a very nice thumbnail run down of what Elliott wave theory is all about.
Terminology. Here are some links to information about some of the technical jargon I use.
Charts. On my charts, waves have a subscript showing the degree above or below the Intermediate degree. Here are the subscripts and the degree each represents:
- {+3} Supercycle
- {+2} Cycle
- {+1} Primary
- No subscript: Intermediate
- {-1} Minor
- {-2} Minute
- {-3} Minuette
By Tim Bovee, Portland, Oregon, August 12, 2020
Disclaimer
Tim Bovee, Private Trader tracks the analysis and trades of a private trader for his own accounts. Nothing in this blog constitutes a recommendation to buy or sell stocks, options or any other financial instrument. The only purpose of this blog is to provide education and entertainment.
No trader is ever 100 percent successful in his or her trades. Trading in the stock and option markets is risky and uncertain. Each trader must make trading decisions for his or her own account, and take responsibility for the consequences.
License

All content on Tim Bovee, Private Trader by Timothy K. Bovee is licensed under a Creative Commons Attribution-ShareAlike 4.0 International License.
Based on a work at www.timbovee.com.

You must be logged in to post a comment.