I was curious about the TSLA — news reports on its price movements tend toward the dramatic. As it turns out, when the sharp light of Elliott wave analysis is applied, TSLA is similar to other Blue Chips.
What’s happening now? By this analysis, TSLA peaked on September 1 at 538.75, and then began to decline. I have counted the decline as though it were the beginning of a major downtrend. It could just as well be a corrective pattern what is either a major downtrend, or a correction within an uptrend.
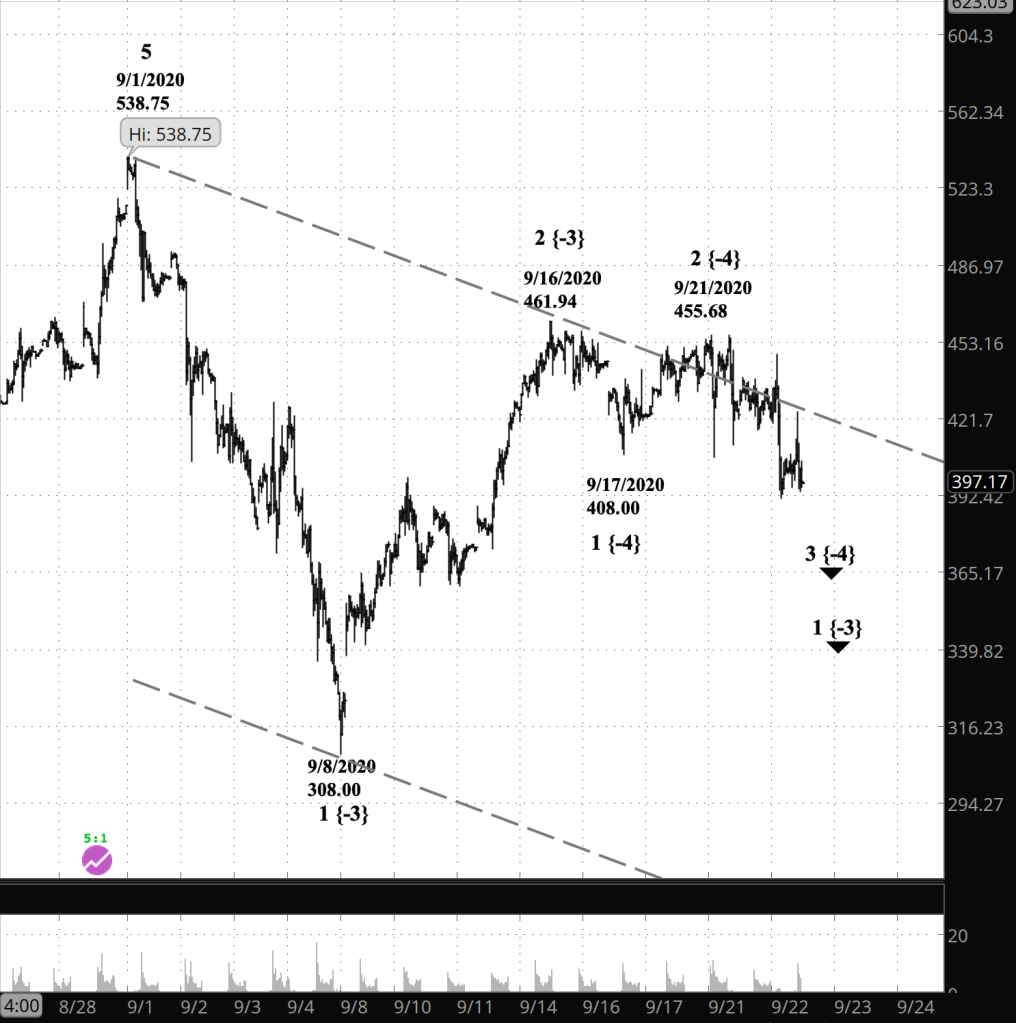
What does Elliott wave analysis say? The first wave down, labelled 1 {-3}, the Minuette degree, ended on September 8 at 308.00. Internally, I count it as five waves, which is correct for a 1st wave.
However, an A wave in a Zigzag correction pattern also has five subwaves.
The second wave, labelled 2 {-3}, peaked on September 16 at 461.94. It has three subwaves — A, B and C at the Subminuette level, as we would expect for wave 2 in a downtrend.
However, a B wave in a Zigzag also has three subwaves.
If the analysis is correct, the present third wave — 3 {-3} — will play out with five subwaves as it declines. So far, I count two complete subwaves, at the Subminuette degree {-4}, with Subminuette 3 underway.
In a Zigzag, wave C also will have five subwaves.
So how do we tell the difference? Elliott wave analysis is famous for its ambiguities. But it has rules that will eventually eliminate one or the other of the possibilities.
The current wave will be followed by an upward movement. If the decline from September 1 is the beginning of a downtrend, then that upward movement will be a 2nd wave correction and will remain below the beginning of the first wave of Minuette degree, 538.75.
If early September’s decline was a correction within an ongoing uptrend, then the price will move above 538.75 and the shorts will have a very bad day.
On the larger TSLA chart, I count five waves up from June 3, 2019, when the stock sold for 35.40, so my best conclusion is that TSLA has begun a significant downtrend.
I’m not planning to trade TSLA options today. If I were, it would be a short bear call spread or short iron condor, the latter hedge reflecting TSLA’s tendency toward large and sudden moves.
By Tim Bovee, Portland, Oregon, December 31, 2020
Disclaimer
Tim Bovee, Private Trader tracks the analysis and trades of a private trader for his own accounts. Nothing in this blog constitutes a recommendation to buy or sell stocks, options or any other financial instrument. The only purpose of this blog is to provide education and entertainment.
No trader is ever 100 percent successful in his or her trades. Trading in the stock and option markets is risky and uncertain. Each trader must make trading decisions for his or her own account, and take responsibility for the consequences.
License
All content on Tim Bovee, Private Trader by Timothy K. Bovee is licensed under a Creative Commons Attribution-ShareAlike 4.0 International License.
Based on a work at www.timbovee.com.

You must be logged in to post a comment.