10:50 p.m. New York time
What’s happening now? The S&P 500 index rose after yesterday’s sharp decline and has exceeded the high point from which the decline began
What does it mean? My alternative analysis appears to better reflect what’s happening; the decline marks the boundary between two parts of a compound correction pattern.
What is the alternative? The whole 4th wave could be a triangular formation.
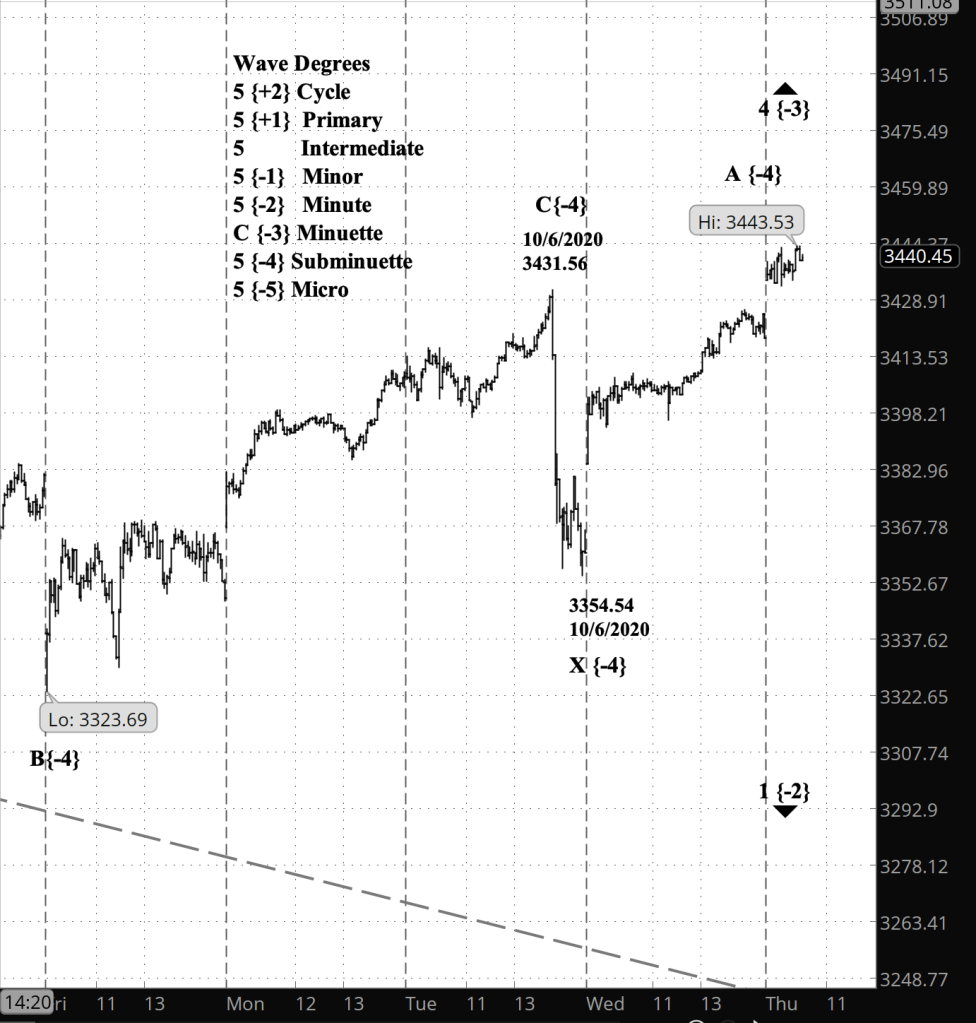
What does Elliott wave theory say? Under what is now my principle analysis, the high yesterday marks the end of Subminuette wave C within Minuette wave 4, which in turn is a subwave of Minute wave 1, the first part of the dominant downward trend. The subsequent decline is Subminuette wave X, a separator, as Minuette wave 4 continues with Subminuette wave A of the second part of a compound correction.
My trading strategy. My short bear call options spread on IWM is in losing territory under the new analysis. I’ll exit on the dip, for either a small profit or a loss. I shall continue to hold my shares in SDS, an ETF that runs to the inverse of the S&P 500.
Learning and other resources. Elliott Wave International has long been the leading analytical house based on Elliott wave theory. They make available a number of free educational materials and other resources, in addition to their for-pay subscriptions.
I recommend two books, both by people associated with EWI.
First, Elliott Wave Principle by Robert Prechter and A.J. Frost is the book that, along with Prechter’s analyses, that created the revival of Elliott wave theory. I first read it in 1984, and it has had a profound influenced on my thinking about markets ever since.
Second, I’ve found Visual Guide to Elliott Wave Trading by Wayne Gorman and Jeffrey Kennedy, both of EWI, to be a useful book that relates Elliott wave theory to practical trading. The authors are hands-on Elliotticians, and for an active trader, that’s exactly what’s needed — less theory and more how-to. The first chapter of the book gives a very nice thumbnail run down of what Elliott wave theory is all about.
Terminology. Here are some links to information about some of the technical jargon I use.
Charts. On my charts, waves have a subscript showing the degree above or below the Intermediate degree. Here are the subscripts and the degree each represents:
- {+3} Supercycle
- {+2} Cycle
- {+1} Primary
- No subscript: Intermediate
- {-1} Minor
- {-2} Minute
- {-3} Minuette
By Tim Bovee, Portland, Oregon, October 8, 2020
Disclaimer
Tim Bovee, Private Trader tracks the analysis and trades of a private trader for his own accounts. Nothing in this blog constitutes a recommendation to buy or sell stocks, options or any other financial instrument. The only purpose of this blog is to provide education and entertainment.
No trader is ever 100 percent successful in his or her trades. Trading in the stock and option markets is risky and uncertain. Each trader must make trading decisions for his or her own account, and take responsibility for the consequences.
License
All content on Tim Bovee, Private Trader by Timothy K. Bovee is licensed under a Creative Commons Attribution-ShareAlike 4.0 International License.
Based on a work at www.timbovee.com.

You must be logged in to post a comment.