2:50 p.m. New York time
I’ve updated the chart for late in the session, showing that wave 5 of Micro degree has begun its rise.
10:20 a.m. New York time
What’s happening now? The S&P 500 index and E-mini futures declined in overnight trading by 109 points, a downward correction within an upward movement that will end with a final upward push.
Since the move occurred during futures trading — the index doesn’t capture trades outside of the normal stock-exchange hours — my discussion and the chart will focus on the futures.
What does it mean? The decline since yesterday, October 14, is in the next-to-the-last portion of the larger upward correction. The coming upward move will likely mark the end of the correction, although it is possible that the corrective move will extend in a compound pattern that will stretch it out in time.
What is the alternative? It’s possible, although I don’t consider it likely, that the October 12 high was in fact the end of the upward correction, and the movement we’ve seen since are the early stages of a resumption of the major downward trend that began on September 2.
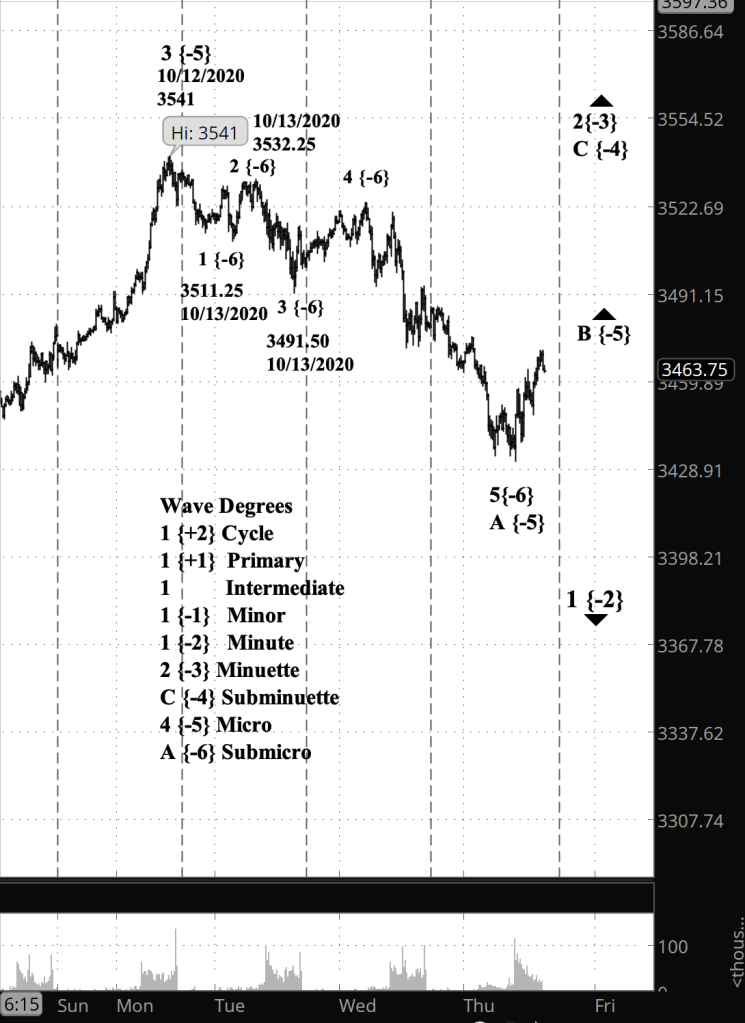
What does Elliott wave theory say? The present downward movement is wave 5 of Submicro degree, the final wave of the movement, within wave 4 of Micro degree within wave C of Subminuette degree. All of that is happening within a 2nd wave upward correction at the Minuette degree within a main downtrend that began on September 2 that follows a rise dating back to at least 1974.
The end of Submicro 5 also marks the end of Micro 4. The uptrending Micro 5 will most likely carry the price above the September 2 high of 3588.11 on the index chart.
A small technical point: In the decline from October 12 wave 3 of Submicro degree seems quite short compared to the large Submicro 5 wave. The rule I have to account for in my count is that a 3rd wave can’t be shorter than both the 1st and 5th waves of the movement. In this instance, Submicro wave 1 on the futures chart 29.75 points in length, and wave 3 is 40.75 points. So the count is compliant with the rule.
My trading strategy. My short bear call spread options positions on IWM are closer to the profitability than before the drop, but are not yet profitable. My question: Do I exit for a small loss or do I hold until closer to expiration, which is 37 days away. The entirety of Minuette wave 1 took 14 days, so my inclination is to hold in the expectation that the main downtrend will resume significantly before the options expire.
I continue to hold my shares of SDS, an inverse ETF that profits when the S&P 500 index loses.
Learning and other resources. Elliott Wave International has long been the leading analytical house based on Elliott wave theory. They make available a number of free educational materials and other resources, in addition to their for-pay subscriptions.
I recommend two books, both by people associated with EWI.
First, Elliott Wave Principle by Robert Prechter and A.J. Frost is the book that, along with Prechter’s analyses, that created the revival of Elliott wave theory. I first read it in 1984, and it has had a profound influenced on my thinking about markets ever since.
Second, I’ve found Visual Guide to Elliott Wave Trading by Wayne Gorman and Jeffrey Kennedy, both of EWI, to be a useful book that relates Elliott wave theory to practical trading. The authors are hands-on Elliotticians, and for an active trader, that’s exactly what’s needed — less theory and more how-to. The first chapter of the book gives a very nice thumbnail run down of what Elliott wave theory is all about.
Terminology. Here are some links to information about some of the technical jargon I use.
Charts. On my charts, waves have a subscript showing the degree above or below the Intermediate degree. Here are the subscripts and the degree each represents:
- {+3} Supercycle
- {+2} Cycle
- {+1} Primary
- No subscript: Intermediate
- {-1} Minor
- {-2} Minute
- {-3} Minuette
By Tim Bovee, Portland, Oregon, October 15, 2020
Disclaimer
Tim Bovee, Private Trader tracks the analysis and trades of a private trader for his own accounts. Nothing in this blog constitutes a recommendation to buy or sell stocks, options or any other financial instrument. The only purpose of this blog is to provide education and entertainment.
No trader is ever 100 percent successful in his or her trades. Trading in the stock and option markets is risky and uncertain. Each trader must make trading decisions for his or her own account, and take responsibility for the consequences.
License
All content on Tim Bovee, Private Trader by Timothy K. Bovee is licensed under a Creative Commons Attribution-ShareAlike 4.0 International License.
Based on a work at www.timbovee.com.

You must be logged in to post a comment.