10:15 a.m. New York time
What’s happening now? The S&P 500 E-mini futures fell overnight to 3402.50, eight points below the October 19 minimum of 3410.75, the lowest the price has gone since the upward correction peak of 3549.85 on October 12.
What does it mean? That new low resolves much of the ambiguity in my count, and I’ve renumbered the chart to reflect an end to the upward correction and a resumption of the downtrend that began September 2. This is what I called the first alternative in my post yesterday, October 21.
What is the alternative? The first alternative having now become the principle count, the former principle is still on the books as an alternative. A rise above the peak of October 20, of 3508.50, would heighten the likelihood the correction is still underway.
The charts. I’ve used the futures for the chart in order to capture the overnight trading in detail. The index itself doesn’t trade outside of normal exchange hours. For the big picture, I’ve added a second chart showing the index itself.
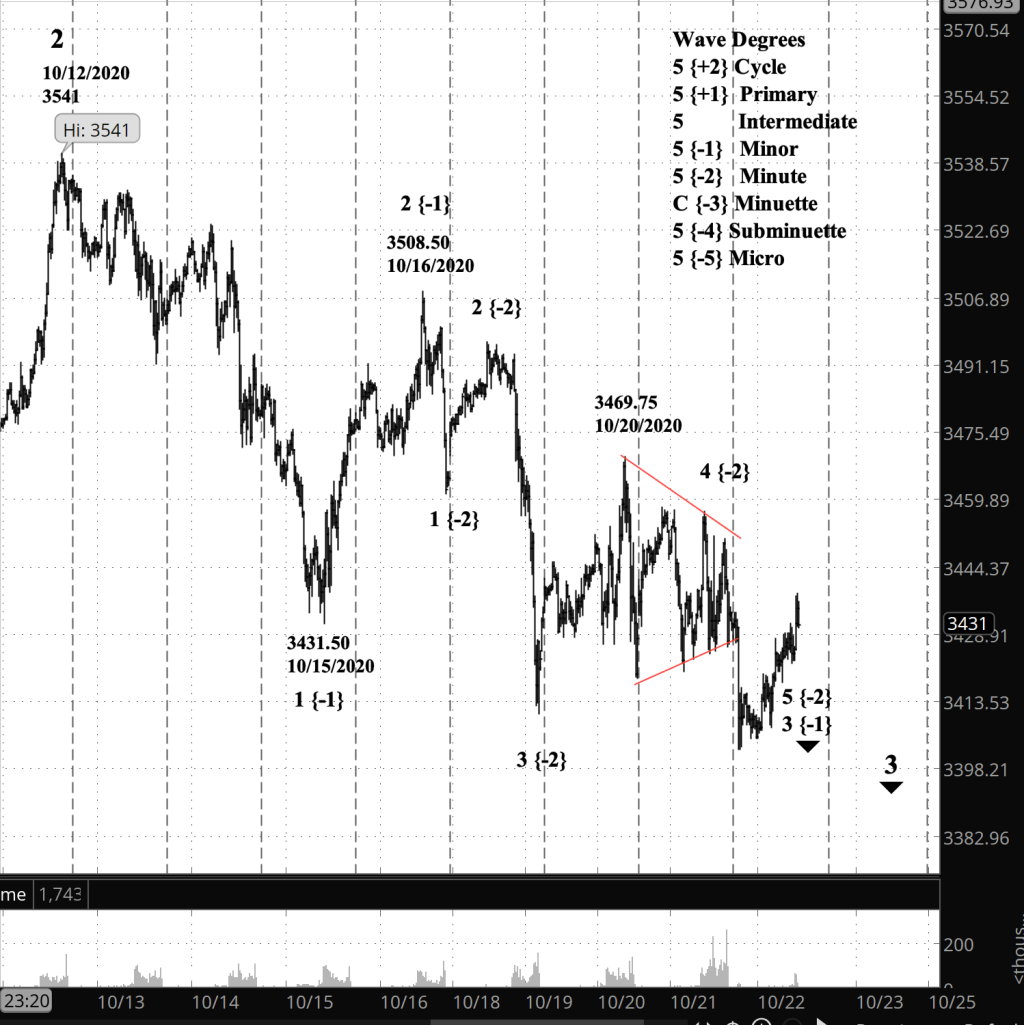
What does Elliott wave theory say? Wave 2 of intermediate degree, the upward correction, peaked on October 12 and internally is close to completing its 3rd wave of Minor degree. If the Intermediate 3rd wave is rapid, it will carry the price down to the mid-3100s, the lower level of the price channel shown on the index chart.
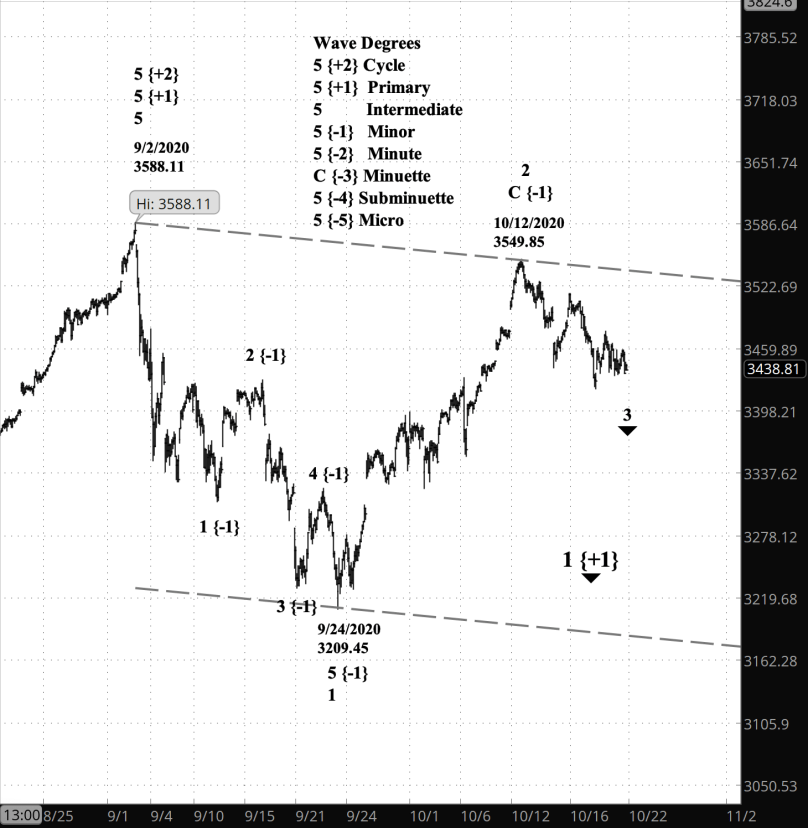
My trading strategy. The new principle count will be good for my options positions, which are bearish. Assuming, of course, if the chart plays out as my analysis suggests. Likewise, the advent of Intermediate wave 3 will benefit my shares of SDS, an inverse fund.
Learning and other resources. Elliott Wave International has long been the leading analytical house based on Elliott wave theory. They make available a number of free educational materials and other resources, in addition to their for-pay subscriptions.
I recommend two books, both by people associated with EWI.
First, Elliott Wave Principle by Robert Prechter and A.J. Frost is the book that, along with Prechter’s analyses, that created the revival of Elliott wave theory. I first read it in 1984, and it has had a profound influenced on my thinking about markets ever since.
Second, I’ve found Visual Guide to Elliott Wave Trading by Wayne Gorman and Jeffrey Kennedy, both of EWI, to be a useful book that relates Elliott wave theory to practical trading. The authors are hands-on Elliotticians, and for an active trader, that’s exactly what’s needed — less theory and more how-to. The first chapter of the book gives a very nice thumbnail run down of what Elliott wave theory is all about.
Terminology. Here are some links to information about some of the technical jargon I use.
Charts. On my charts, waves have a subscript showing the degree above or below the Intermediate degree. Here are the subscripts and the degree each represents:
- {+3} Supercycle
- {+2} Cycle
- {+1} Primary
- No subscript: Intermediate
- {-1} Minor
- {-2} Minute
- {-3} Minuette
By Tim Bovee, Portland, Oregon, October xx, 2020
Disclaimer
Tim Bovee, Private Trader tracks the analysis and trades of a private trader for his own accounts. Nothing in this blog constitutes a recommendation to buy or sell stocks, options or any other financial instrument. The only purpose of this blog is to provide education and entertainment.
No trader is ever 100 percent successful in his or her trades. Trading in the stock and option markets is risky and uncertain. Each trader must make trading decisions for his or her own account, and take responsibility for the consequences.
License
All content on Tim Bovee, Private Trader by Timothy K. Bovee is licensed under a Creative Commons Attribution-ShareAlike 4.0 International License.
Based on a work at www.timbovee.com.

You must be logged in to post a comment.