12:30 p.m. New York time
I’ve updated the chart with about 30 minutes to go before the closing bell. Very little movement today, beyond a slight hook downward that could mark the end of wave 4 of Minute degree, or a continuation of that upward correction — impossible to say which at this point.
9:40 a.m. New York time
What’s happening now? The S&P 500 index is in the late stage of its decline from October 12. It presently stands midway between the boundaries of the trend channel.
What does it mean? Once the decline is over, the index and its associated funds and futures will trace an upward correction, perhaps to the 3450s, and then turn to the final portion of the decline.
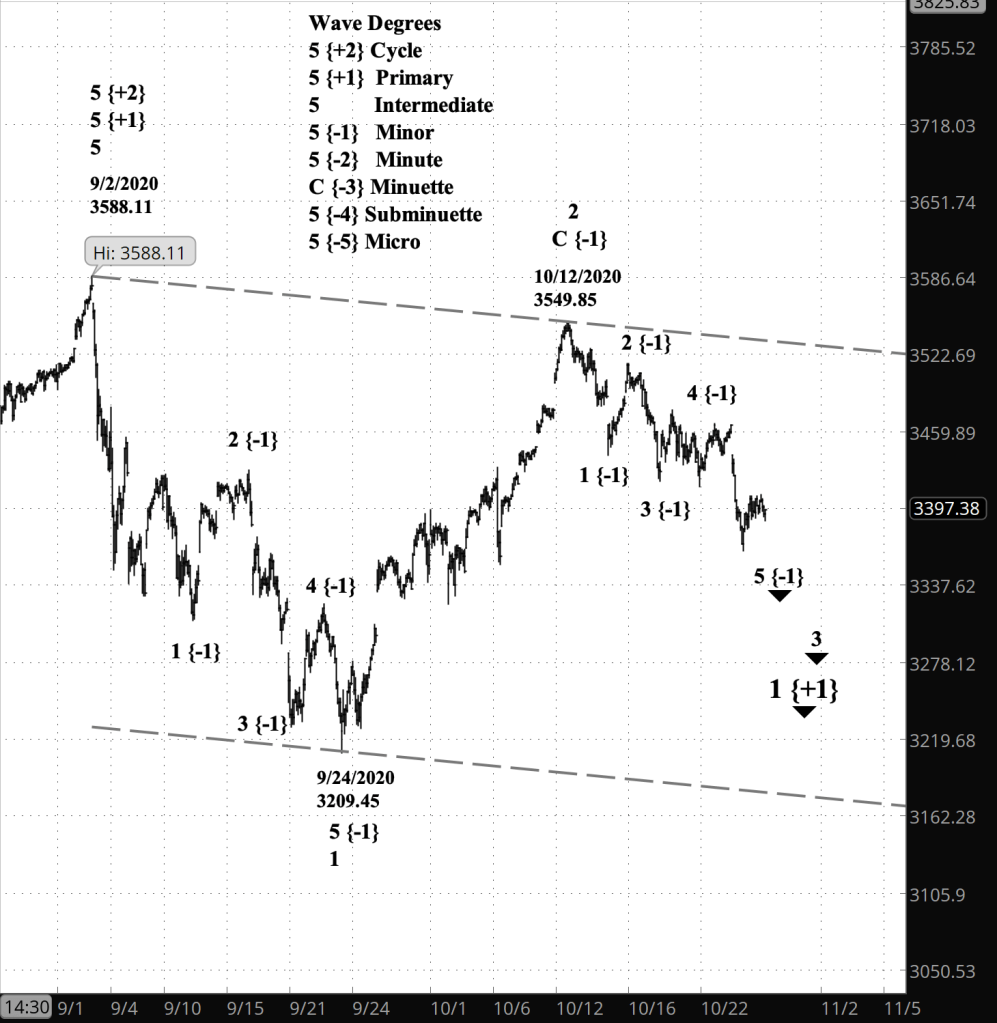
What does Elliott wave theory say? October 12 marked the beginning of wave 3 of Intermediate degree, the middle portion of the greater wave 1 of Primary degree, which began September 2.
Considered in greater detail, Intermediate wave 3 has reached its Minor 5 subwave, which in turn is tracing its Minute 4 subwave, the final upward correction within Intermediate 3.
At the opening bell this morning the price declined below yesterday’s low (October 26), which could mark the beginning of Minute wave 5, one level below Minor. Or perhaps not. It could be a continuation of Minute wave 4, which began yesterday.
My trading strategy. I’m holding my short bear call options spreads on IWM until at least Friday, longer if they’re not yet profitable. I’m operating on the presumption that Minute wave 5 of Minor wave 5 will return the position to profitability. I must avoid the start of Intermediate wave 4, an upward correction. I’m continuing to hold my shares in SDS, which profit when the S&P 500 decline, using Primary wave 1 as my guide.
Learning and other resources. Elliott Wave International has long been the leading analytical house based on Elliott wave theory. They make available a number of free educational materials and other resources, in addition to their for-pay subscriptions.
I recommend two books, both by people associated with EWI.
First, Elliott Wave Principle by Robert Prechter and A.J. Frost is the book that, along with Prechter’s analyses, that created the revival of Elliott wave theory. I first read it in 1984, and it has had a profound influenced on my thinking about markets ever since.
Second, I’ve found Visual Guide to Elliott Wave Trading by Wayne Gorman and Jeffrey Kennedy, both of EWI, to be a useful book that relates Elliott wave theory to practical trading. The authors are hands-on Elliotticians, and for an active trader, that’s exactly what’s needed — less theory and more how-to. The first chapter of the book gives a very nice thumbnail run down of what Elliott wave theory is all about.
Terminology. Here are some links to information about some of the technical jargon I use.
Charts. On my charts, waves have a subscript showing the degree above or below the Intermediate degree. Here are the subscripts and the degree each represents:
- {+3} Supercycle
- {+2} Cycle
- {+1} Primary
- No subscript: Intermediate
- {-1} Minor
- {-2} Minute
- {-3} Minuette
By Tim Bovee, Portland, Oregon, October 27, 2020
Disclaimer
Tim Bovee, Private Trader tracks the analysis and trades of a private trader for his own accounts. Nothing in this blog constitutes a recommendation to buy or sell stocks, options or any other financial instrument. The only purpose of this blog is to provide education and entertainment.
No trader is ever 100 percent successful in his or her trades. Trading in the stock and option markets is risky and uncertain. Each trader must make trading decisions for his or her own account, and take responsibility for the consequences.
License
All content on Tim Bovee, Private Trader by Timothy K. Bovee is licensed under a Creative Commons Attribution-ShareAlike 4.0 International License.
Based on a work at www.timbovee.com.

You must be logged in to post a comment.