3:25 p.m. New York time
I’ve updated the chart with half an hour before the closing bell.
9:45 a.m. New York time
What’s happening now? The S&P 500 index is tracing the third step, an upward movement within a low level upward correction.
What does it mean? Two possibilities. 1) The correction will end with the third step and will resume its downward path. 2) The index will trace a downward boundary movement and then will begin another pattern in a compound correction that will be on the shallow side.
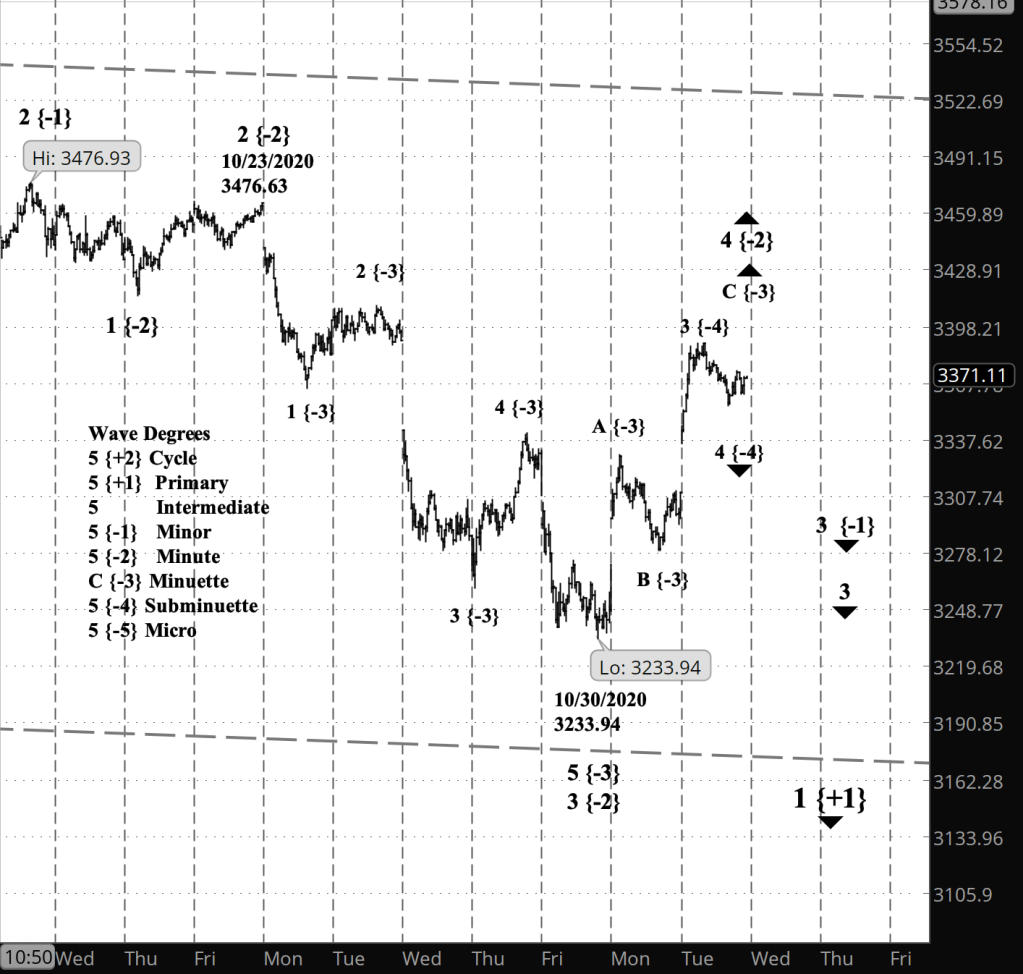
What does Elliott wave theory say? The uptrending correction, wave 4 of Minute degree, has completed two internal waves, A and B of Minuete degree, and has begun rising in wave C.
If the C wave completes the correction, then it we followed by wave 1 of Minuette degree within wave 5 of Minute degree, the fifth wave being the final downward push of the 3rd wave correction of Minor degree.
If the correction turns into a compound movement, stringing several corrective together, then the decline following wave C will be an X wave of Minuette degree, a boundary between two patterns.
The difficulty is that the X wave (= correction continuing) and the 1st wave (= correction over) will initially exactly the same. The X wave will have three internal waves, and the 1st wave will have five internal waves. The truth of which we’re seeing will unfold over time.
My trading strategy. I’m looking to enter a new bear call spread position on one of the funds the tracks the S&P 500 closely, using the options that expire December 18. My preferred entry date for that series is today, November 3. It’s not going to happen. I’ll need to see some indication that the Minute 5th wave decline has begun.
Learning and other resources. Elliott Wave International has long been the leading analytical house based on Elliott wave theory. They make available a number of free educational materials and other resources, in addition to their for-pay subscriptions.
I recommend two books, both by people associated with EWI.
First, Elliott Wave Principle by Robert Prechter and A.J. Frost is the book that, along with Prechter’s analyses, that created the revival of Elliott wave theory. I first read it in 1984, and it has had a profound influenced on my thinking about markets ever since.
Second, I’ve found Visual Guide to Elliott Wave Trading by Wayne Gorman and Jeffrey Kennedy, both of EWI, to be a useful book that relates Elliott wave theory to practical trading. The authors are hands-on Elliotticians, and for an active trader, that’s exactly what’s needed — less theory and more how-to. The first chapter of the book gives a very nice thumbnail run down of what Elliott wave theory is all about.
Terminology. Here are some links to information about some of the technical jargon I use.
Charts. On my charts, waves have a subscript showing the degree above or below the Intermediate degree. Here are the subscripts and the degree each represents:
- {+3} Supercycle
- {+2} Cycle
- {+1} Primary
- No subscript: Intermediate
- {-1} Minor
- {-2} Minute
- {-3} Minuette
By Tim Bovee, Portland, Oregon, November 3, 2020
Disclaimer
Tim Bovee, Private Trader tracks the analysis and trades of a private trader for his own accounts. Nothing in this blog constitutes a recommendation to buy or sell stocks, options or any other financial instrument. The only purpose of this blog is to provide education and entertainment.
No trader is ever 100 percent successful in his or her trades. Trading in the stock and option markets is risky and uncertain. Each trader must make trading decisions for his or her own account, and take responsibility for the consequences.
License
All content on Tim Bovee, Private Trader by Timothy K. Bovee is licensed under a Creative Commons Attribution-ShareAlike 4.0 International License.
Based on a work at www.timbovee.com.

You must be logged in to post a comment.