9:50 a.m. New York time
What’s happening now? The S&P 500 index begins the day little changed as it traces out the very early steps in what will become a significant decline.
What does it mean? The decline will carry the price down to the lower boundary of the expanding Diagonal Triangle (red lines) that began in December 2018. The lower boundary is presently at 2131 and is declining by about $3 per day. The longer the journey down, the lower the boundary.
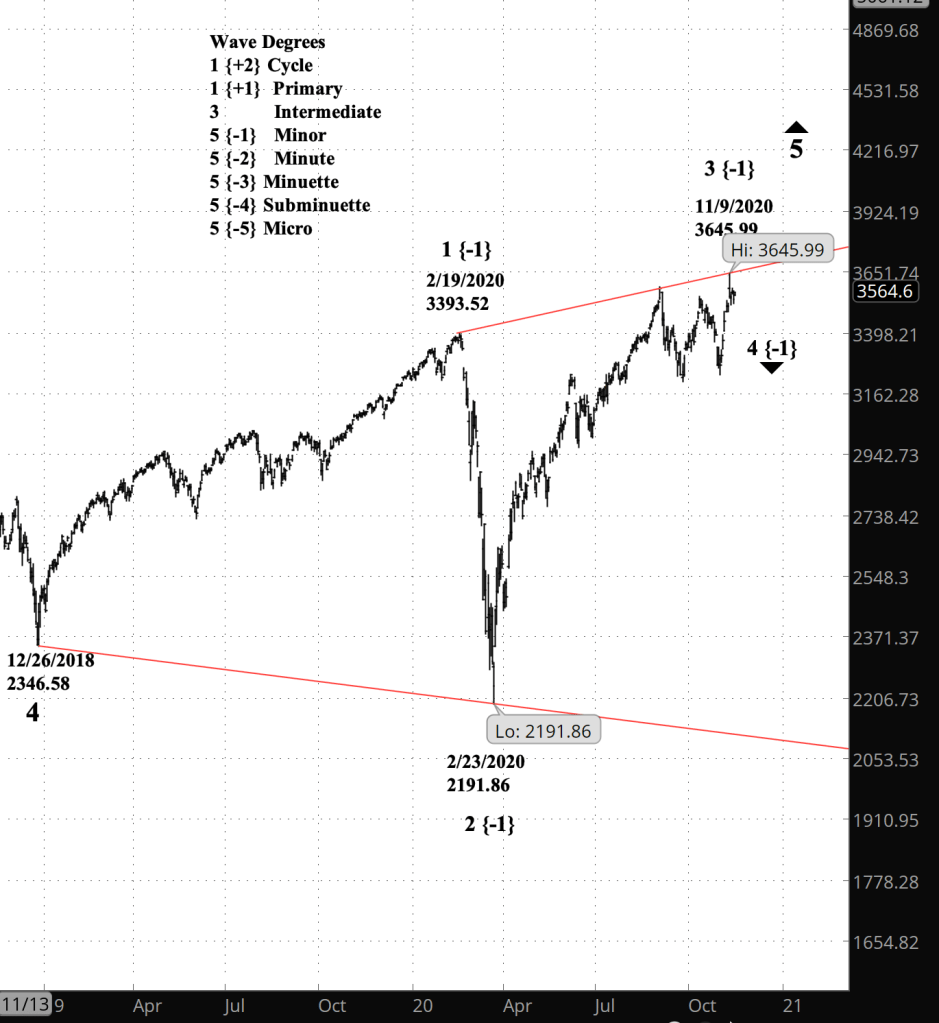
What does Elliott wave theory say? The triangle is presently beginning wave 4 of Minor degree. The preceding Minor wave 3 began at 2191.86 on February 23 and ended at 3645.99 on November 9. This is gives some idea of the magnitudes of time and distance that lie ahead.
The downtrending Minor wave 4 will be followed by an uptrending Minor wave 5, which will carry back to the upper boundary, marking the end of the parent wave, Intermediate wave 5. The upper boundary is moving higher each day — such is the nature of an expanding triangle — and so wave 5 will move to higher levels than we’ve seen this year.
My trading strategy. I’m waiting for a good entry point for options, with a bear call vertical spread as my strategy. I’m holding on to my bearish shares in the inverse fund SDS.
Learning and other resources. Elliott Wave International has long been the leading analytical house based on Elliott wave theory. They make available a number of free educational materials and other resources, in addition to their for-pay subscriptions.
I recommend two books, both by people associated with EWI.
First, Elliott Wave Principle by Robert Prechter and A.J. Frost is the book that, along with Prechter’s analyses, that created the revival of Elliott wave theory. I first read it in 1984, and it has had a profound influenced on my thinking about markets ever since.
Second, I’ve found Visual Guide to Elliott Wave Trading by Wayne Gorman and Jeffrey Kennedy, both of EWI, to be a useful book that relates Elliott wave theory to practical trading. The authors are hands-on Elliotticians, and for an active trader, that’s exactly what’s needed — less theory and more how-to. The first chapter of the book gives a very nice thumbnail run down of what Elliott wave theory is all about.
Terminology. Here are some links to information about some of the technical jargon I use.
Charts. On my charts, waves have a subscript showing the degree above or below the Intermediate degree. Here are the subscripts and the degree each represents:
- {+3} Supercycle
- {+2} Cycle
- {+1} Primary
- No subscript: Intermediate
- {-1} Minor
- {-2} Minute
- {-3} Minuette
By Tim Bovee, Portland, Oregon, November 13, 2020
Disclaimer
Tim Bovee, Private Trader tracks the analysis and trades of a private trader for his own accounts. Nothing in this blog constitutes a recommendation to buy or sell stocks, options or any other financial instrument. The only purpose of this blog is to provide education and entertainment.
No trader is ever 100 percent successful in his or her trades. Trading in the stock and option markets is risky and uncertain. Each trader must make trading decisions for his or her own account, and take responsibility for the consequences.
License
All content on Tim Bovee, Private Trader by Timothy K. Bovee is licensed under a Creative Commons Attribution-ShareAlike 4.0 International License.
Based on a work at www.timbovee.com.

You must be logged in to post a comment.