3:30 p.m. New York time
I’ve updated the chart with half an hour to go before the closing bell.
9:55 a.m. New York time
What’s happening now? The S&P 500 continues to work their way downward within a countertrend correction.
What does it mean? The downward movement will be followed by a rise above the November 9 high, completing the countertrend correction and beginning a decline to the lower boundary of the Diagonal Triangle that began in December 2018.
What is the alternative? The Dow Jones Industrial Average reached a new high, exceeding the November 9 peak. If the S&P 500 does the same — it hasn’t yet on the indexes or the futures — then the analysis would show the new peak to be the beginning of the downward correction.
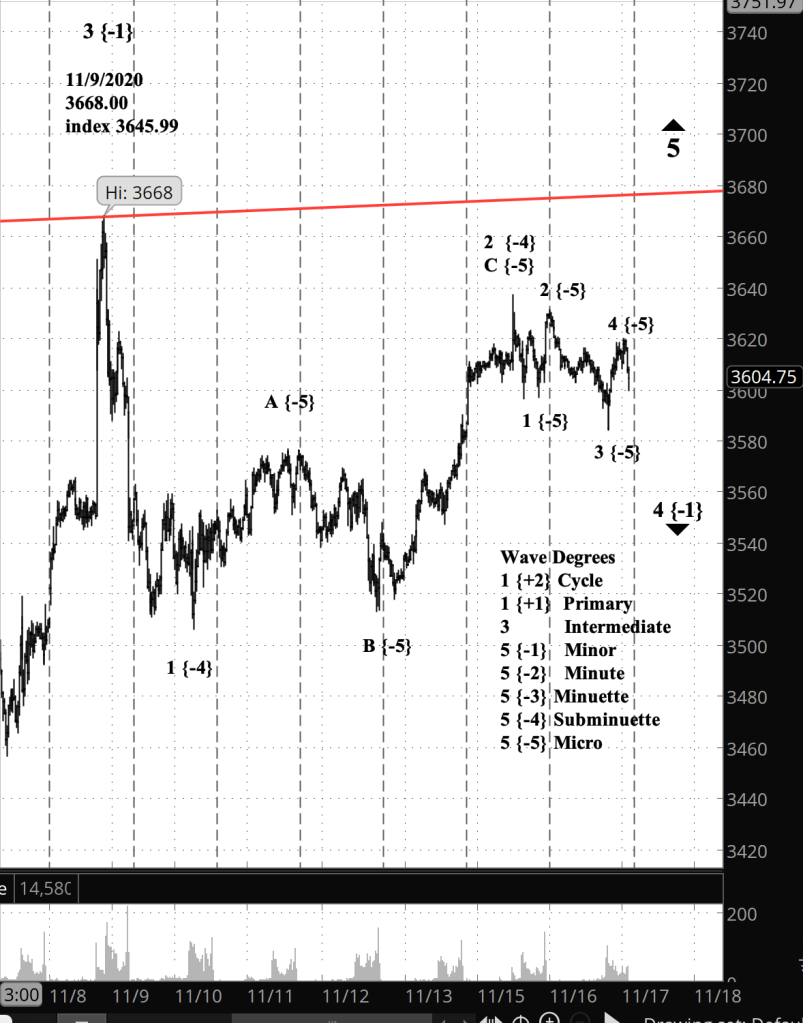
What does Elliott wave theory say? The November 9 peak marked the end of Minor wave 3 to the upside and beginning of Minor wave 4 to the downside. Both waves are components of Intermediate wave 5 to the upside, a Diagonal Triangle forming the final sub-wave of Primary wave 5, which began in 2009.
My trading strategy. I’m delaying entry into options positions — short bear call spreads — until I’m certain that Minor wave 3 is truly over. I’m continuing to hold my bearish stock positions.
Learning and other resources. Elliott Wave International has long been the leading analytical house based on Elliott wave theory. They make available a number of free educational materials and other resources, in addition to their for-pay subscriptions.
I recommend two books, both by people associated with EWI.
First, Elliott Wave Principle by Robert Prechter and A.J. Frost is the book that, along with Prechter’s analyses, that created the revival of Elliott wave theory. I first read it in 1984, and it has had a profound influenced on my thinking about markets ever since.
Second, I’ve found Visual Guide to Elliott Wave Trading by Wayne Gorman and Jeffrey Kennedy, both of EWI, to be a useful book that relates Elliott wave theory to practical trading. The authors are hands-on Elliotticians, and for an active trader, that’s exactly what’s needed — less theory and more how-to. The first chapter of the book gives a very nice thumbnail run down of what Elliott wave theory is all about.
Terminology. Here are some links to information about some of the technical jargon I use.
Charts. On my charts, waves have a subscript showing the degree above or below the Intermediate degree. Here are the subscripts and the degree each represents:
- {+3} Supercycle
- {+2} Cycle
- {+1} Primary
- No subscript: Intermediate
- {-1} Minor
- {-2} Minute
- {-3} Minuette
By Tim Bovee, Portland, Oregon, November 17, 2020
Disclaimer
Tim Bovee, Private Trader tracks the analysis and trades of a private trader for his own accounts. Nothing in this blog constitutes a recommendation to buy or sell stocks, options or any other financial instrument. The only purpose of this blog is to provide education and entertainment.
No trader is ever 100 percent successful in his or her trades. Trading in the stock and option markets is risky and uncertain. Each trader must make trading decisions for his or her own account, and take responsibility for the consequences.
License
All content on Tim Bovee, Private Trader by Timothy K. Bovee is licensed under a Creative Commons Attribution-ShareAlike 4.0 International License.
Based on a work at www.timbovee.com.

You must be logged in to post a comment.