3:30 p.m. New York time
I’ve updated the chart at 30 minutes before the closing bell. The chart shows wave 4 of Subminuette degree has begun its run to the upside.
9:50 a.m. New York time
What’s happening now? The S&P 500 E-mini futures dropped sharply in overnight trading, from a daily high of 3623.25 down to a low of 3542.50.
What does it mean? The decline came as five waves, meeting the requirement for completion of the decline that began November 16. The next movement will be an upward move that will stay below 3668, and perhaps below 3623.25.
What is the alternative? There’s sufficient ambiguity in wave counting that the decline might not yet be over, and that would put off the rise to a later date.
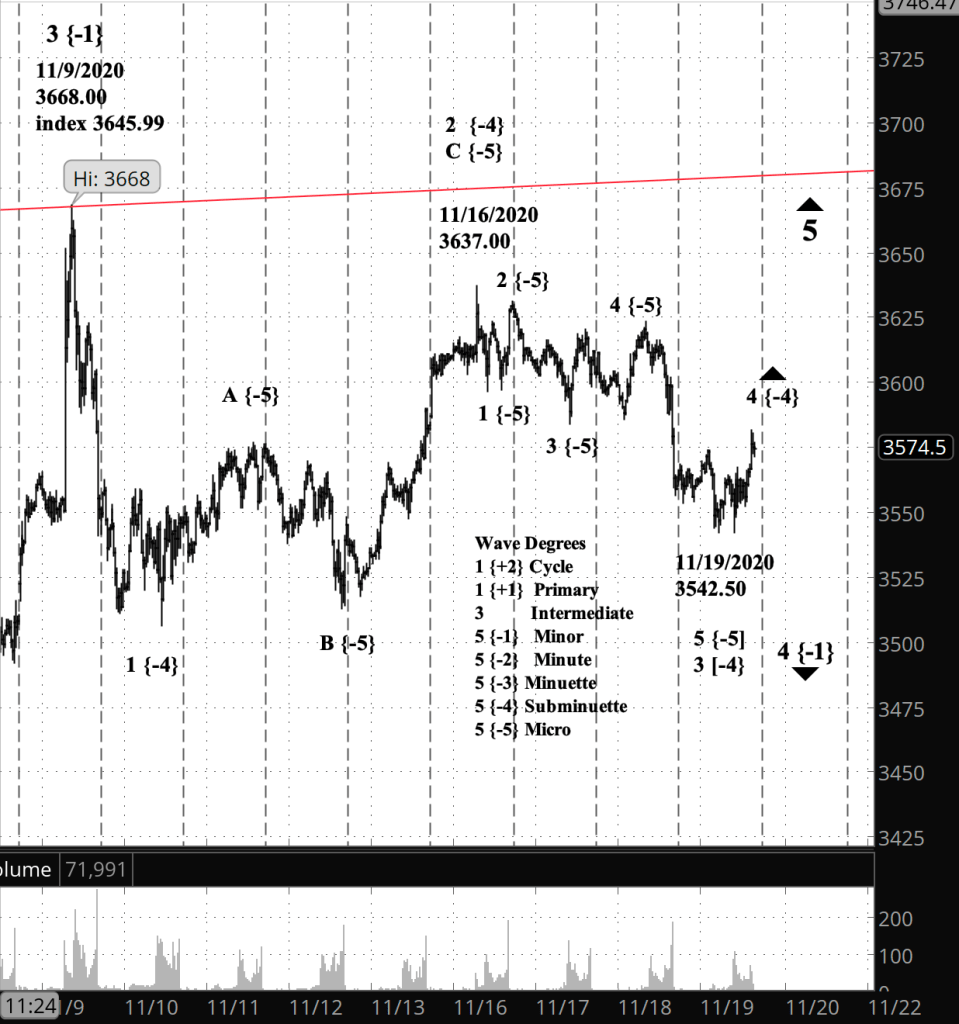
What does Elliott wave theory say? These are all small-scale movements within Minor wave 4, a downward movement that began with the 3rd wave peak on November 9, at 3645.99 on index, 3668 on the futures. The overnight decline was wave 5 of Micro degree, and it completed wave 3 of Subminuette degree, which began on November 16 at 3637 on the futures.
The usual caveat: I’m uncertain about the degree of the subwaves of Minor wave 4. It could be that what I called Micro will turn out to be Minuette, and what I call Subminuette will be counted as Minute, moving the present count up by two degrees. But I’m not willing to reach that conclusion yet.
My trading strategy. In terms of Elliott wave analysis, I won’t be willing to re-enter options until I can resolve the ambiguity in judging the degree. I want to catch the main decline within Minor wave 4, and at this point I can’t define when that would be.
No ambiguity about my bearish shares in SDS. I’m hanging on at least until the price approaches the lower boundary of the Diagonal Triangle that began in December 2018. The red line on the chart is the upper boundary of the triangle.
Learning and other resources. Elliott Wave International has long been the leading analytical house based on Elliott wave theory. They make available a number of free educational materials and other resources, in addition to their for-pay subscriptions.
I recommend two books, both by people associated with EWI.
First, Elliott Wave Principle by Robert Prechter and A.J. Frost is the book that, along with Prechter’s analyses, that created the revival of Elliott wave theory. I first read it in 1984, and it has had a profound influenced on my thinking about markets ever since.
Second, I’ve found Visual Guide to Elliott Wave Trading by Wayne Gorman and Jeffrey Kennedy, both of EWI, to be a useful book that relates Elliott wave theory to practical trading. The authors are hands-on Elliotticians, and for an active trader, that’s exactly what’s needed — less theory and more how-to. The first chapter of the book gives a very nice thumbnail run down of what Elliott wave theory is all about.
Terminology. Here are some links to information about some of the technical jargon I use.
Charts. On my charts, waves have a subscript showing the degree above or below the Intermediate degree. Here are the subscripts and the degree each represents:
- {+3} Supercycle
- {+2} Cycle
- {+1} Primary
- No subscript: Intermediate
- {-1} Minor
- {-2} Minute
- {-3} Minuette
By Tim Bovee, Portland, Oregon, November 19, 2020
Disclaimer
Tim Bovee, Private Trader tracks the analysis and trades of a private trader for his own accounts. Nothing in this blog constitutes a recommendation to buy or sell stocks, options or any other financial instrument. The only purpose of this blog is to provide education and entertainment.
No trader is ever 100 percent successful in his or her trades. Trading in the stock and option markets is risky and uncertain. Each trader must make trading decisions for his or her own account, and take responsibility for the consequences.
License
All content on Tim Bovee, Private Trader by Timothy K. Bovee is licensed under a Creative Commons Attribution-ShareAlike 4.0 International License.
Based on a work at www.timbovee.com.

You must be logged in to post a comment.