7 a.m. New York time
What’s happening now? The S&P 500 index continues a largely sideways movement within an upward correction that is in turn part of a downward correction.
What does it mean? Having touched the upper boundary (red line) of the Diagonal Triangle that began in December 2018, the price is now working its way down in a move that will eventually reach the lower boundary, which is presently in the vicinity of 2125.
About the chart. I’ve moved the subwaves of the correction up a couple of degrees, so that what had been labelled the Subminuette degree {-4} is now labeled the Minute degree {-2}. The ambiguities are still in place, but as the parent wave plays out, the new labeling seems increasingly more likely. If events lower the likelihood, then I’ll change the degree structure in my analysis.
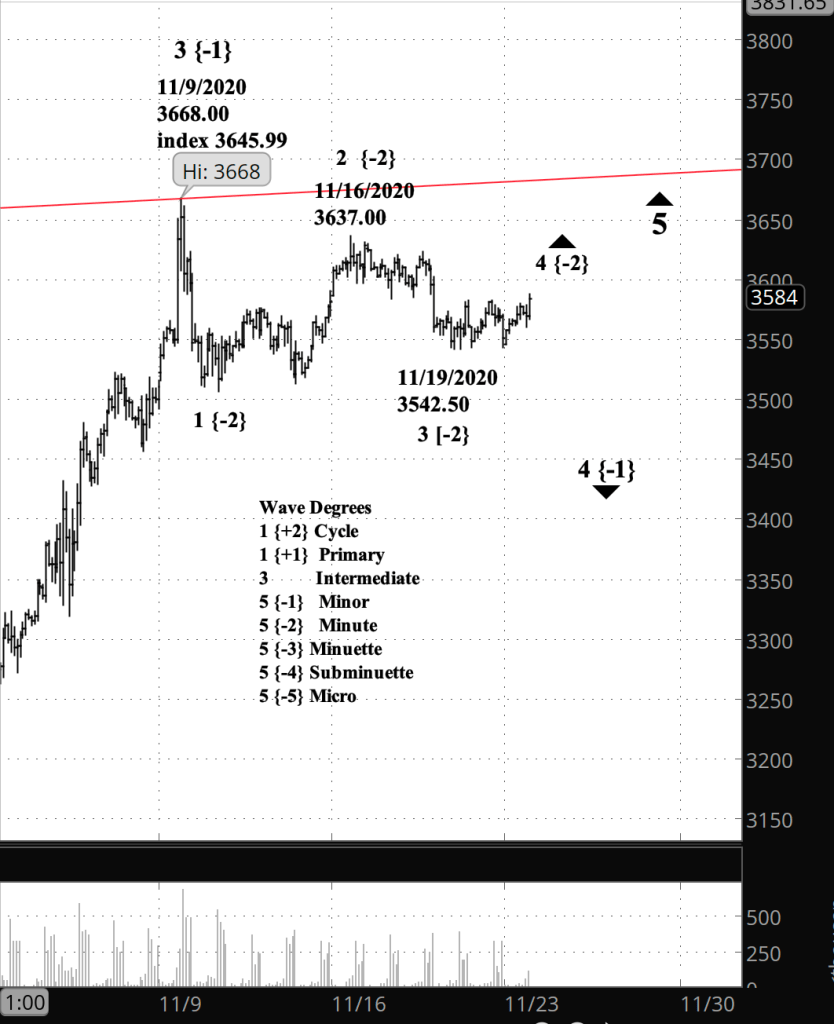
What does Elliott wave theory say? The present sideways motion is wave 4 of Minute degree, an upward correction, within wave 4 of Minor degree, a downward correction, both within uptrending wave 5 of Intermediate degree.
My trading strategy. By my rules the entry period for the options that expire January 15 begins tomorrow and will run through December 8, and I’ll be considering whether to enter and what vehicle to use in light of my Elliott wave analysis. I know that Minor wave 4 will carry the price lower, and that’s the wave I would want to catch. Except it’s a 4th wave, which can be tricky, if the the variety of forms they take. A short iron condor is one possibility, if I can construct it with a sufficiently wide zone of profit. My stocks, which are in the bear fund SDS: I’m continuing to hold them in anticipation of a decline to the lower boundary of the Diagonal Triangle.
Learning and other resources. Elliott Wave International has long been the leading analytical house based on Elliott wave theory. They make available a number of free educational materials and other resources, in addition to their for-pay subscriptions.
I recommend two books, both by people associated with EWI.
First, Elliott Wave Principle by Robert Prechter and A.J. Frost is the book that, along with Prechter’s analyses, that created the revival of Elliott wave theory. I first read it in 1984, and it has had a profound influenced on my thinking about markets ever since.
Second, I’ve found Visual Guide to Elliott Wave Trading by Wayne Gorman and Jeffrey Kennedy, both of EWI, to be a useful book that relates Elliott wave theory to practical trading. The authors are hands-on Elliotticians, and for an active trader, that’s exactly what’s needed — less theory and more how-to. The first chapter of the book gives a very nice thumbnail run down of what Elliott wave theory is all about.
Terminology. Here are some links to information about some of the technical jargon I use.
Charts. On my charts, waves have a subscript showing the degree above or below the Intermediate degree. Here are the subscripts and the degree each represents:
- {+3} Supercycle
- {+2} Cycle
- {+1} Primary
- No subscript: Intermediate
- {-1} Minor
- {-2} Minute
- {-3} Minuette
By Tim Bovee, Portland, Oregon, November 23, 2020
Disclaimer
Tim Bovee, Private Trader tracks the analysis and trades of a private trader for his own accounts. Nothing in this blog constitutes a recommendation to buy or sell stocks, options or any other financial instrument. The only purpose of this blog is to provide education and entertainment.
No trader is ever 100 percent successful in his or her trades. Trading in the stock and option markets is risky and uncertain. Each trader must make trading decisions for his or her own account, and take responsibility for the consequences.
License
All content on Tim Bovee, Private Trader by Timothy K. Bovee is licensed under a Creative Commons Attribution-ShareAlike 4.0 International License.
Based on a work at www.timbovee.com.

You must be logged in to post a comment.