10 a.m. New York time
What’s happening now? The S&P 500 rose again during holiday trading of the E-mini futures, exceeding the high of November 26.
What does it mean? The upward correction that began November 24 continues and is now in its third wave. That wave should be almost over, and will be followed either a resumption of the downtrend or a separator wave that portends a complex correction pattern.
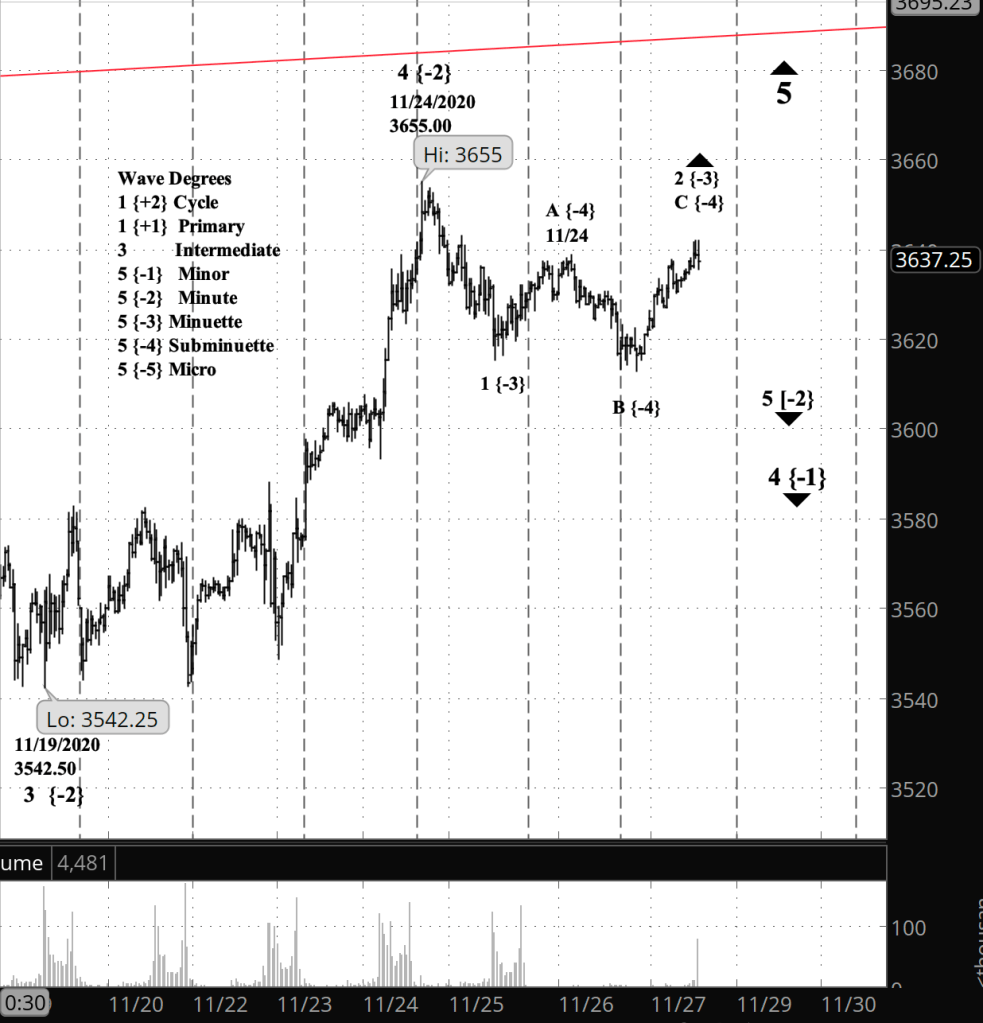
What does Elliott wave theory say? The present downtrend is Minor wave 4, and the present subwave is Minute wave 5 to the downside. That 5th wave is working through its 2nd subwave, of Minuette degree, an upward correction within the downtrend. The present rise within Minuette 2 is wave C of Subminuette degree. Following C’s completion, the next move will either be the beginning of Minuette wave 3 or a Minuette wave X, the latter being a dividing wave within a complex correction pattern. Second waves tend to be simple — A, B, C and done — and so I think the most likely outcome will be the start of Minuette wave 3.
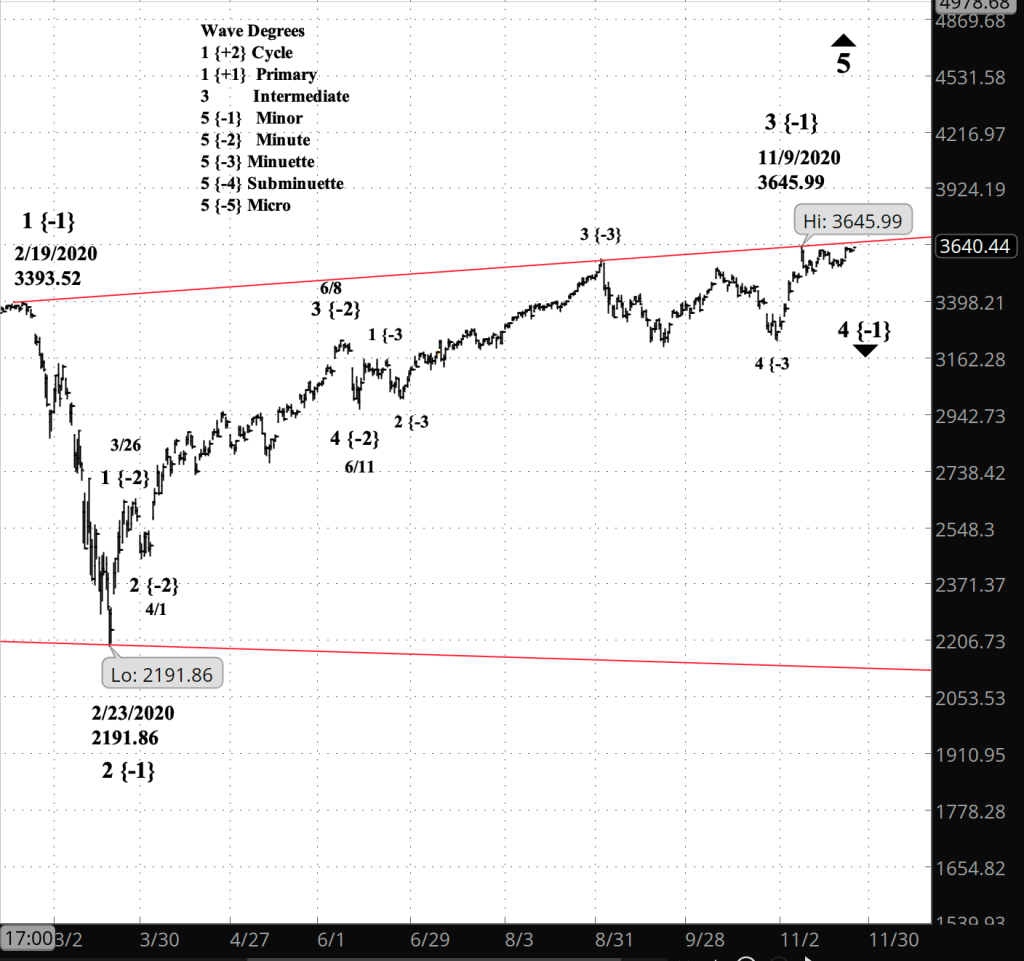
Big picture, the price is still hugging the upper boundary (red line) of the Diagonal Triangle that began in December 2018. The smaller movements described above are all within Intermediate wave 5, which can be expected to carry the price down to the triangle’s lower boundary, presently at 2135 and continuing its gradual decline.
My trading strategy. On Monday I plan to think of entering options position that expire in January, most likely using IWM, which tracks the Russell 2000 index, as my vehicle. I’m continuing to hold my shares in the bear-oriented fund SDS.
Learning and other resources. Elliott Wave International has long been the leading analytical house based on Elliott wave theory. They make available a number of free educational materials and other resources, in addition to their for-pay subscriptions.
I recommend two books, both by people associated with EWI.
First, Elliott Wave Principle by Robert Prechter and A.J. Frost is the book that, along with Prechter’s analyses, that created the revival of Elliott wave theory. I first read it in 1984, and it has had a profound influenced on my thinking about markets ever since.
Second, I’ve found Visual Guide to Elliott Wave Trading by Wayne Gorman and Jeffrey Kennedy, both of EWI, to be a useful book that relates Elliott wave theory to practical trading. The authors are hands-on Elliotticians, and for an active trader, that’s exactly what’s needed — less theory and more how-to. The first chapter of the book gives a very nice thumbnail run down of what Elliott wave theory is all about.
Terminology. Here are some links to information about some of the technical jargon I use.
Charts. On my charts, waves have a subscript showing the degree above or below the Intermediate degree. Here are the subscripts and the degree each represents:
- {+3} Supercycle
- {+2} Cycle
- {+1} Primary
- No subscript: Intermediate
- {-1} Minor
- {-2} Minute
- {-3} Minuette
By Tim Bovee, Portland, Oregon, November 27, 2020
Disclaimer
Tim Bovee, Private Trader tracks the analysis and trades of a private trader for his own accounts. Nothing in this blog constitutes a recommendation to buy or sell stocks, options or any other financial instrument. The only purpose of this blog is to provide education and entertainment.
No trader is ever 100 percent successful in his or her trades. Trading in the stock and option markets is risky and uncertain. Each trader must make trading decisions for his or her own account, and take responsibility for the consequences.
License
All content on Tim Bovee, Private Trader by Timothy K. Bovee is licensed under a Creative Commons Attribution-ShareAlike 4.0 International License.
Based on a work at www.timbovee.com.

You must be logged in to post a comment.