3:30 p.m. New York time
Half an hour before the closing bell the S&P 500 continues through the early stages of a downward correction, having completed five waves down and three waves up today as steps in the decline. I’ve updated the chart below.
10:35 a.m. New York time
What’s happening now? The S&P 500 index and its derivatives continue to pull back slightly from Tuesday’s high, 3678.45 around the upper boundary of a Diagonal Triangle form that began in December 2018.
What does it mean? The peak ended an upward push that began February 23, 2020 from 2191.86. The next move will be a downward correction and then a final wave to the upside.
What is the alternative? The price remains near the high and it is possible that rather than withdrawing immediately, the price might bounce up to a slightly higher level before beginning its downward movement.
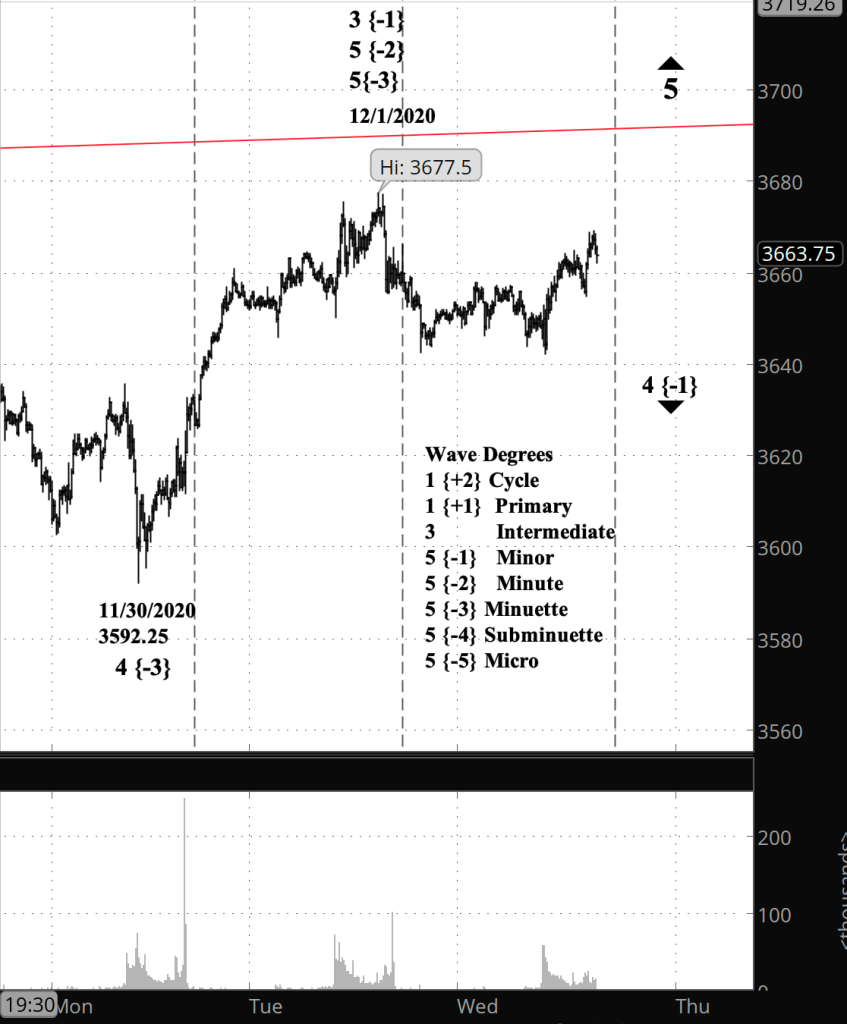
What does Elliott wave theory say? Tuesday’s high marks the end of wave 3 of Minor degree, after two days short of 10 months to the day. What follows is Minor wave 4 to the downside. Fourth wave corrections often tend to trend sideways, suggesting the downward move will be shallow. All of this is happening within Intermediate wave 5, which is one degree higher.
My trading strategy. My short bear call options spreads on IWM, with 44 days until expiration on January 15, continue to hold near the level of their entry credit. Decision day on exiting will come 21 days prior to expiration, on December 25 by the calendar. Since the market will be closed that day, the decision, at the latest, will made on December 23. I continue to hold my shares in the inverse S&P 500 fund SDS.
Learning and other resources. Elliott Wave International has long been the leading analytical house based on Elliott wave theory. They make available a number of free educational materials and other resources, in addition to their for-pay subscriptions.
I recommend two books, both by people associated with EWI.
First, Elliott Wave Principle by Robert Prechter and A.J. Frost is the book that, along with Prechter’s analyses, that created the revival of Elliott wave theory. I first read it in 1984, and it has had a profound influenced on my thinking about markets ever since.
Second, I’ve found Visual Guide to Elliott Wave Trading by Wayne Gorman and Jeffrey Kennedy, both of EWI, to be a useful book that relates Elliott wave theory to practical trading. The authors are hands-on Elliotticians, and for an active trader, that’s exactly what’s needed — less theory and more how-to. The first chapter of the book gives a very nice thumbnail run down of what Elliott wave theory is all about.
Terminology. Here are some links to information about some of the technical jargon I use.
Charts. On my charts, waves have a subscript showing the degree above or below the Intermediate degree. Here are the subscripts and the degree each represents:
- {+3} Supercycle
- {+2} Cycle
- {+1} Primary
- No subscript: Intermediate
- {-1} Minor
- {-2} Minute
- {-3} Minuette
By Tim Bovee, Portland, Oregon, December 2, 2020
Disclaimer
Tim Bovee, Private Trader tracks the analysis and trades of a private trader for his own accounts. Nothing in this blog constitutes a recommendation to buy or sell stocks, options or any other financial instrument. The only purpose of this blog is to provide education and entertainment.
No trader is ever 100 percent successful in his or her trades. Trading in the stock and option markets is risky and uncertain. Each trader must make trading decisions for his or her own account, and take responsibility for the consequences.
License
All content on Tim Bovee, Private Trader by Timothy K. Bovee is licensed under a Creative Commons Attribution-ShareAlike 4.0 International License.
Based on a work at www.timbovee.com.

You must be logged in to post a comment.