3:30 p.m. New York time
The S&P 500 continued to decline during the day. I’ve updated the chart, below, with some preliminary wave labels on the decline.
10:20 a.m. New York time
What’s happening now? The S&P 500 index and its derivatives remain above the upper boundary of a two-year-long Diagonal Triangle, peaking at 3714.75 on Tuesday and now curving around toward the downside.In the first 20 minutes of today’s trading the price fell back below the triangle boundary.
What does it mean? Three times so far I’ve had to adjust my analysis of the top of the rise that began in February, and the current top is within the rules of Elliott wave analysis show, as were its predecessors. If this indeed proves to be the top, then the market is preparing for a significant decline.
What is the alternative? It may be that Tuesday’s top will be exceeded, and if that happens, then I’ll adjust the wave count. Elliott wave analysis, after all, is about the implications of what has occurred. It says nothing about the timing of events.
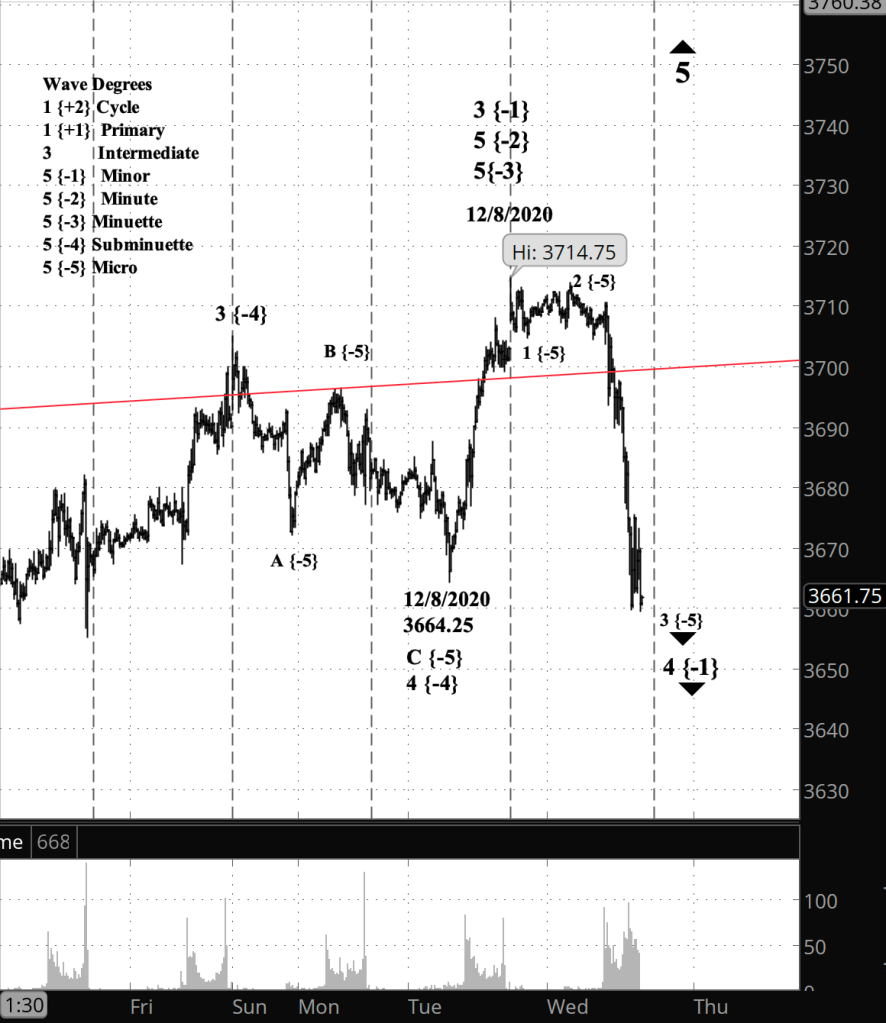
What does Elliott wave theory say? The rise from Tuesday’s low (3664.25) has so far traced five waves, with a bit of ambiguity regarding the first wave. I count that rise as wave 5 of Subminuette degree, leading to a wave 5 completion up to the parent Minute degree, and a wave 3 completion one degree up from there, at the Minor degree.
The fall below the triangle boundary, which happened just minutes ago, marks the beginning of wave 1 of Subminuette degree and, going up the scale, wave 4 of Minor degree.
My trading strategy. I’m continuing to hold my short bear call options spreads and my shares in SDS, an inverse exchange-traded fund based on the S&P 500.
Learning and other resources. Elliott Wave International has long been the leading analytical house based on Elliott wave theory. They make available a number of free educational materials and other resources, in addition to their for-pay subscriptions.
I recommend two books, both by people associated with EWI.
First, Elliott Wave Principle by Robert Prechter and A.J. Frost is the book that, along with Prechter’s analyses, that created the revival of Elliott wave theory. I first read it in 1984, and it has had a profound influenced on my thinking about markets ever since.
Second, I’ve found Visual Guide to Elliott Wave Trading by Wayne Gorman and Jeffrey Kennedy, both of EWI, to be a useful book that relates Elliott wave theory to practical trading. The authors are hands-on Elliotticians, and for an active trader, that’s exactly what’s needed — less theory and more how-to. The first chapter of the book gives a very nice thumbnail run down of what Elliott wave theory is all about.
Terminology. Here are some links to information about some of the technical jargon I use.
Charts. On my charts, waves have a subscript showing the degree above or below the Intermediate degree. Here are the subscripts and the degree each represents:
- {+3} Supercycle
- {+2} Cycle
- {+1} Primary
- No subscript: Intermediate
- {-1} Minor
- {-2} Minute
- {-3} Minuette
By Tim Bovee, Portland, Oregon, December 9, 2020
Disclaimer
Tim Bovee, Private Trader tracks the analysis and trades of a private trader for his own accounts. Nothing in this blog constitutes a recommendation to buy or sell stocks, options or any other financial instrument. The only purpose of this blog is to provide education and entertainment.
No trader is ever 100 percent successful in his or her trades. Trading in the stock and option markets is risky and uncertain. Each trader must make trading decisions for his or her own account, and take responsibility for the consequences.
License
All content on Tim Bovee, Private Trader by Timothy K. Bovee is licensed under a Creative Commons Attribution-ShareAlike 4.0 International License.
Based on a work at www.timbovee.com.

You must be logged in to post a comment.