3:40 p.m. New York time
20 minutes before the closing bell. The S&P 500 continued its C-wave rise in the Micro degree and then reversed slightly, which may or may not indicate the rise is over. I’ve updated the chart below.
10:30 a.m. New York time
What’s happening now? The S&P 500 index and its derivatives reversed after a three-wave decline and rose, although remaining below yesterday’s high.
What does it mean? The reversal clarifies that the upward correction that began December 11 is still underway, completing its middle wave in overnight trading and rising in its third, and possibly final, wave.
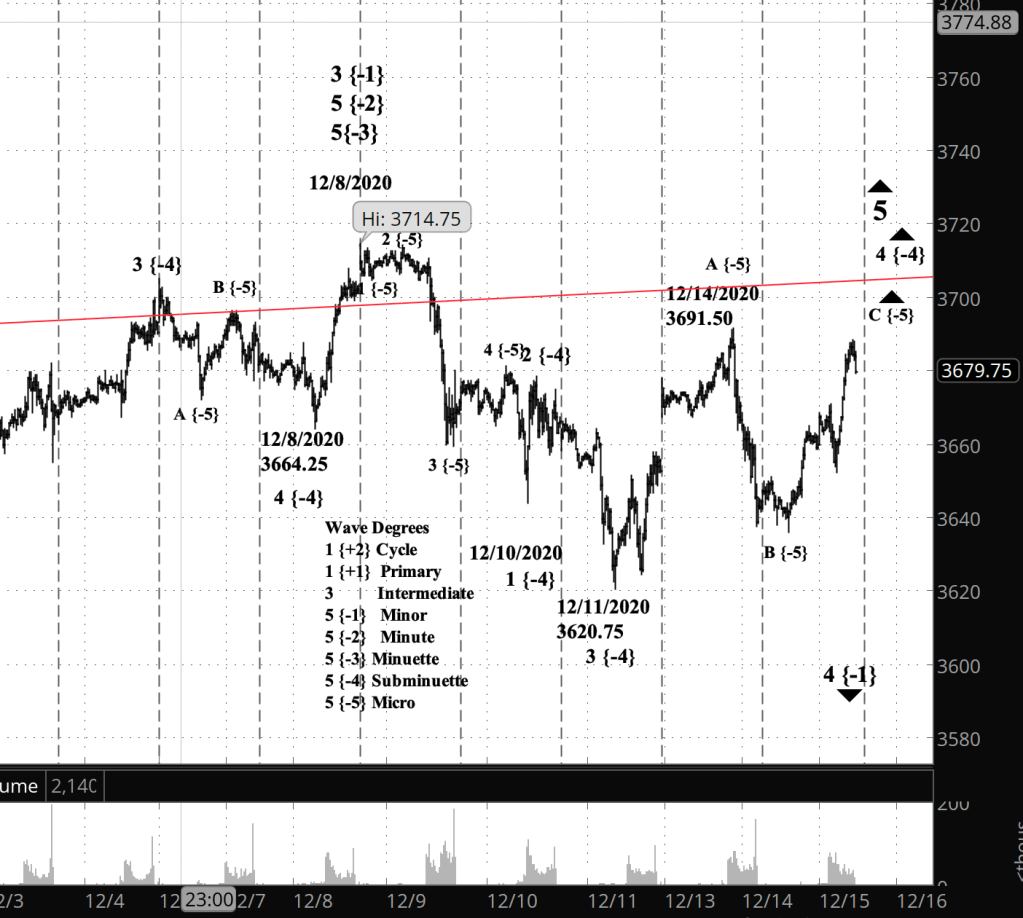
What does Elliott wave theory say? Wave A of Micro degree began its rise December 11 and ended on December 14, beginning the declining wave B, which ended last night around midnight. The present rise is Micro wave C. All of this is happening within wave 4 of Subminuette degree within wave 5 of Minuette degree.
A 4th wave correction tends to trace a sideways movement — a three-wave Flat rather than a three-wave Zigzag — and quite often will trace a compound pattern, gluing on another Flat or a Zigzag, connected to the first pattern with an X wave. There’s no way to tell at this point whether Subminuette 4 will extend through compounding.
Learning and other resources. Elliott Wave International has long been the leading analytical house based on Elliott wave theory. They make available a number of free educational materials and other resources, in addition to their for-pay subscriptions.
I recommend two books, both by people associated with EWI.
First, Elliott Wave Principle by Robert Prechter and A.J. Frost is the book that, along with Prechter’s analyses, that created the revival of Elliott wave theory. I first read it in 1984, and it has had a profound influenced on my thinking about markets ever since.
Second, I’ve found Visual Guide to Elliott Wave Trading by Wayne Gorman and Jeffrey Kennedy, both of EWI, to be a useful book that relates Elliott wave theory to practical trading. The authors are hands-on Elliotticians, and for an active trader, that’s exactly what’s needed — less theory and more how-to. The first chapter of the book gives a very nice thumbnail run down of what Elliott wave theory is all about.
Terminology. Here are some links to information about some of the technical jargon I use.
Charts. On my charts, waves have a subscript showing the degree above or below the Intermediate degree. Here are the subscripts and the degree each represents:
- {+3} Supercycle
- {+2} Cycle
- {+1} Primary
- No subscript: Intermediate
- {-1} Minor
- {-2} Minute
- {-3} Minuette
By Tim Bovee, Portland, Oregon, December xx, 2020
Disclaimer
Tim Bovee, Private Trader tracks the analysis and trades of a private trader for his own accounts. Nothing in this blog constitutes a recommendation to buy or sell stocks, options or any other financial instrument. The only purpose of this blog is to provide education and entertainment.
No trader is ever 100 percent successful in his or her trades. Trading in the stock and option markets is risky and uncertain. Each trader must make trading decisions for his or her own account, and take responsibility for the consequences.
License
All content on Tim Bovee, Private Trader by Timothy K. Bovee is licensed under a Creative Commons Attribution-ShareAlike 4.0 International License.
Based on a work at www.timbovee.com.

You must be logged in to post a comment.