3:30 p.m. New York time
Half an hour before the closing bell. The S&P 500 and its derivatives continued to fall for much of the day, reaching the 3670s. I’ve updated the “Close up” chart, below.
10:20 a.m. New York time
What’s happening now? The S&P 500 E-mini futures moved to a higher high overnight, touching 3723, then reversed and fell nearly 30 points in the minutes before and after the opening bell.
What does it mean? As before, the peak could be the end of the upward correction that began December 11, or at least i’s first phase, a possibility buttressed by the steepness of this morning’s decline. If the correction is indeed over, then the decline would be a resumption of the downtrend that began December 8. If the correction is extending into a compound pattern, then the decline would be a wave that separates two corrective patterns.
What is the alternative? The present pattern within upward correction could still have a bit more upside left.
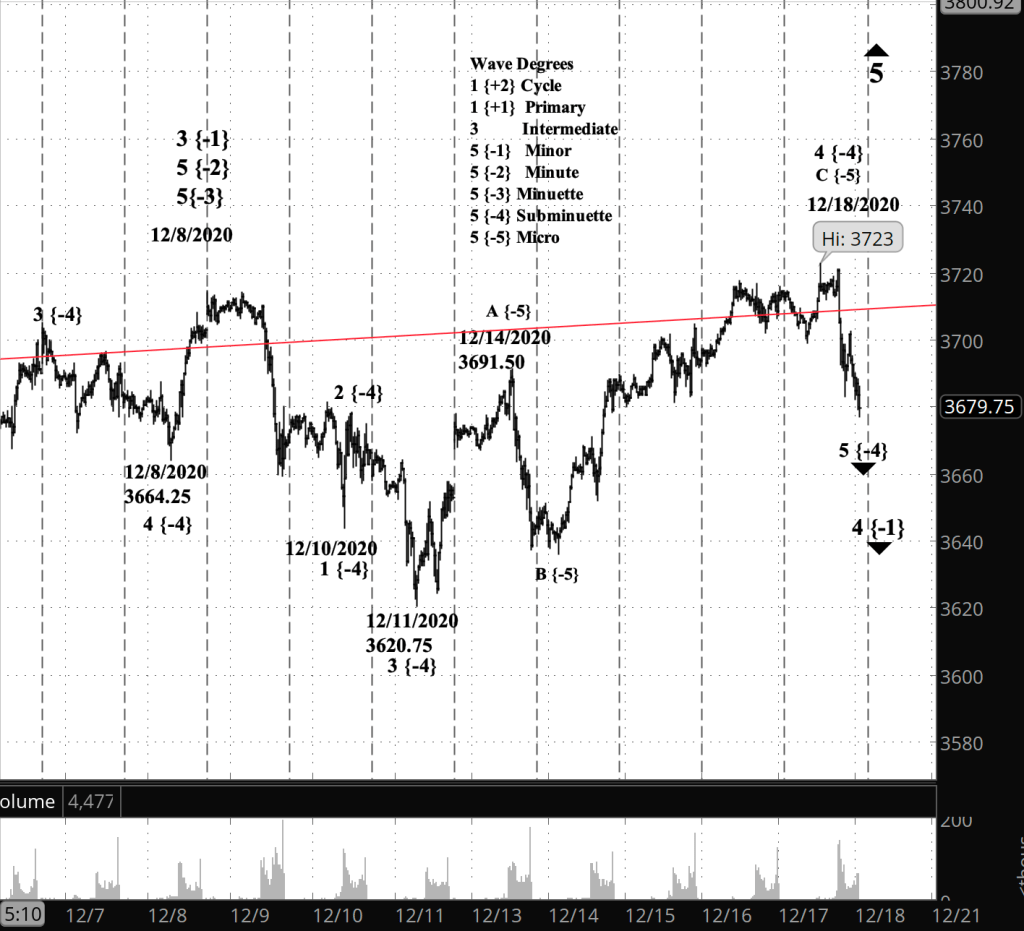
What does Elliott wave theory say? If the correction is over, this morning’s peak ended wave 4 of Subminuette degree and began Subminuette wave 5, as shown in the chart above. If the correction is extending in a compound pattern, the peak began downtrending Subminuette wave X, a separator wave.
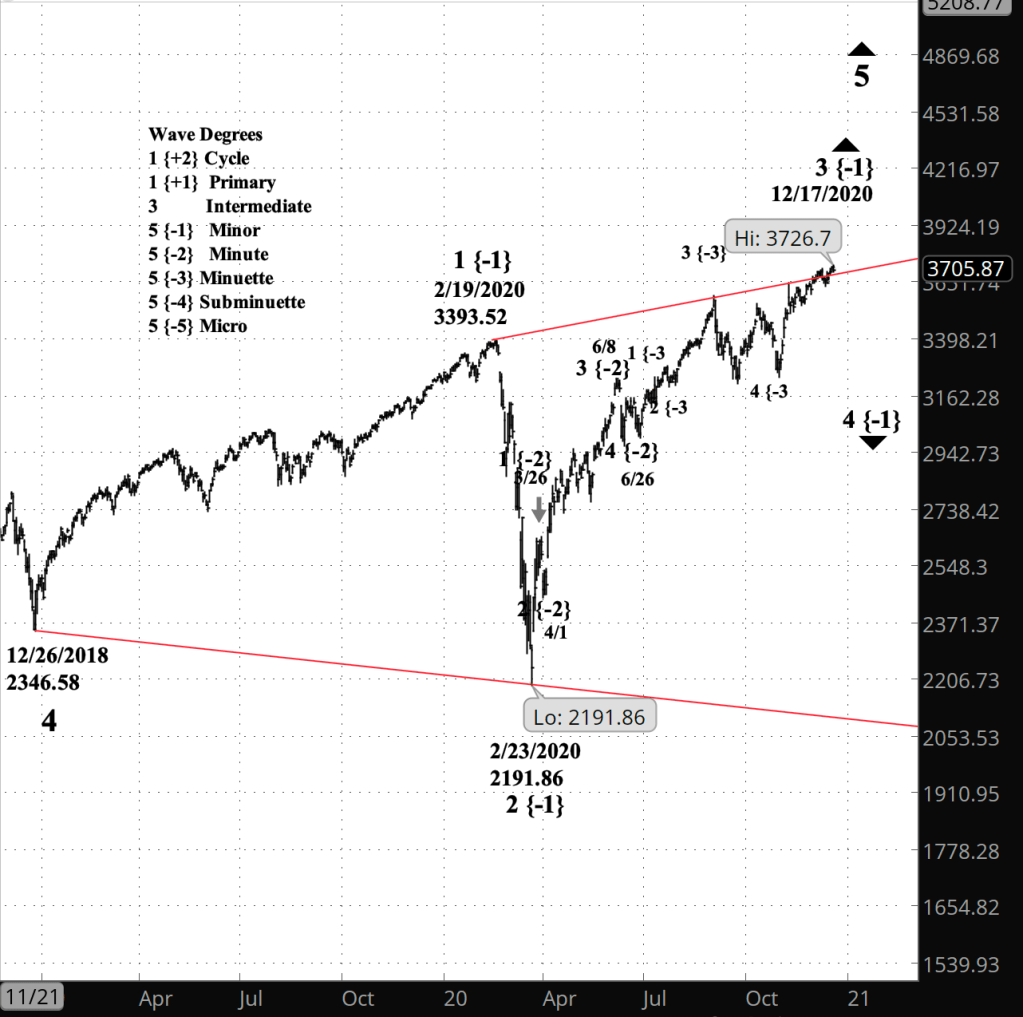
All of this is happening within downtrending wave A of Minuette degree within wave 4 of Minor degree, which in turn is a subwave of uptrending wave 5 of Intermediate degree, which began December 26, 2018 and has taken the form of a Diagonal Triangle, as seen in the chart below.
Learning and other resources. Elliott Wave International has long been the leading analytical house based on Elliott wave theory. They make available a number of free educational materials and other resources, in addition to their for-pay subscriptions.
I recommend two books, both by people associated with EWI.
First, Elliott Wave Principle by Robert Prechter and A.J. Frost is the book that, along with Prechter’s analyses, that created the revival of Elliott wave theory. I first read it in 1984, and it has had a profound influenced on my thinking about markets ever since.
Second, I’ve found Visual Guide to Elliott Wave Trading by Wayne Gorman and Jeffrey Kennedy, both of EWI, to be a useful book that relates Elliott wave theory to practical trading. The authors are hands-on Elliotticians, and for an active trader, that’s exactly what’s needed — less theory and more how-to. The first chapter of the book gives a very nice thumbnail run down of what Elliott wave theory is all about.
Terminology. Here are some links to information about some of the technical jargon I use.
Charts. On my charts, waves have a subscript showing the degree above or below the Intermediate degree. Here are the subscripts and the degree each represents:
- {+3} Supercycle
- {+2} Cycle
- {+1} Primary
- No subscript: Intermediate
- {-1} Minor
- {-2} Minute
- {-3} Minuette
By Tim Bovee, Portland, Oregon, December 18, 2020
Disclaimer
Tim Bovee, Private Trader tracks the analysis and trades of a private trader for his own accounts. Nothing in this blog constitutes a recommendation to buy or sell stocks, options or any other financial instrument. The only purpose of this blog is to provide education and entertainment.
No trader is ever 100 percent successful in his or her trades. Trading in the stock and option markets is risky and uncertain. Each trader must make trading decisions for his or her own account, and take responsibility for the consequences.
License
All content on Tim Bovee, Private Trader by Timothy K. Bovee is licensed under a Creative Commons Attribution-ShareAlike 4.0 International License.
Based on a work at www.timbovee.com.

You must be logged in to post a comment.