3:30 p.m. New York time
Half an hour before the closing bell. The S&P 500 peaked and drop back a little after — apparently — completing the 5th wave within wave C of Micro degree. If in fact C is indeed complete, then the ensuing decline will be either the first step of Subminuette wave 5 to the downside or the beginning of a downward wave X that will glue the corrective pattern just finished to another, future corrective pattern in a compound structure. I’ve updated the chart below.
10:30 a.m. New York time
What’s happening now? The S&P 500 index E-mini futures are working through the third wave of an upward correction that began December 20.
What does it mean? The correction, once complete, will be followed by a downtrend that initially will reach below the beginning of the correction’s beginning at 3596.
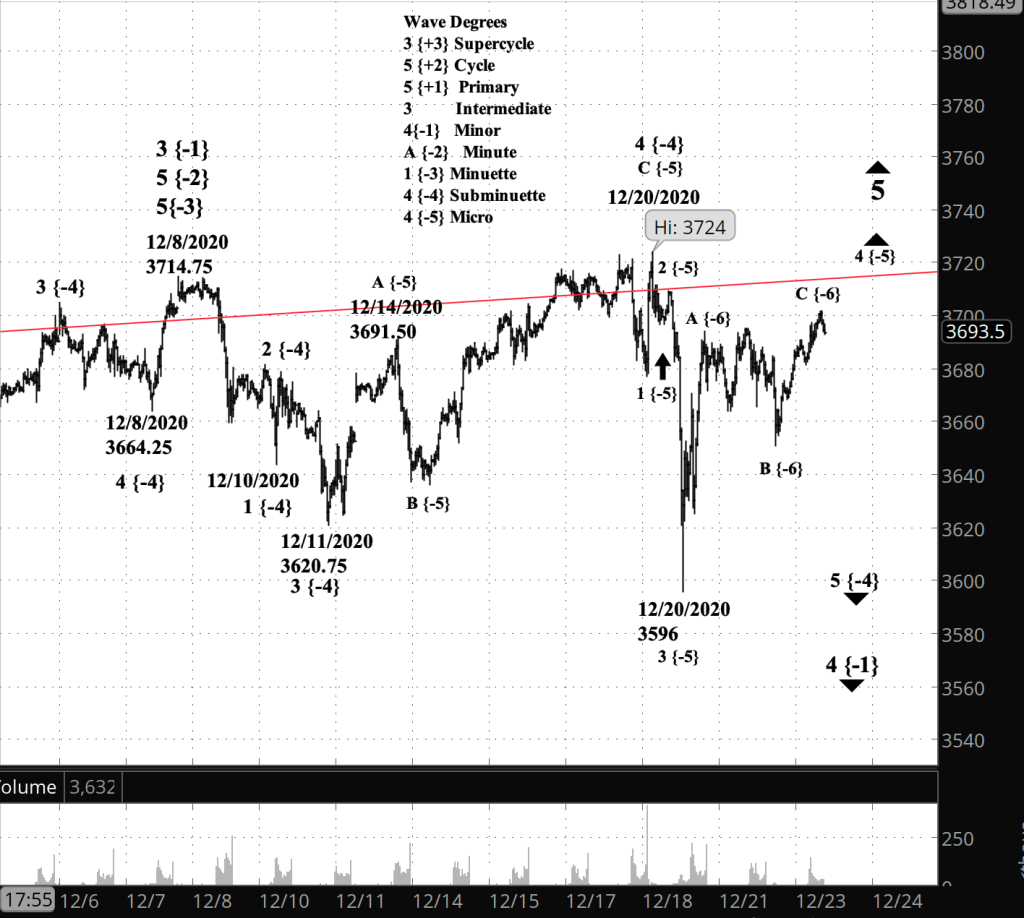
What does Elliott wave theory say? The correction, the 4th wave of Micro degree, has so far traced three waves internally and is now rising in the C wave. The correction is happening within downtrending wave 5 of Subminuette degree, which began on December 20 from 3724.
There’s a lot of complexity to the chart, especially the interrelation of the degrees. To provide guide, I’ve changed the wave numbers in the “Wave Degrees” box to reflect my count on the chart. The low level movements I’ve been tracking are all part of wave 1 of Minuette degree within descending wave A of Minute degree within wave 4 of Minor degree, the latter being a correction within rising wave 5 of Intermediate degree, which began in 2018.
Learning and other resources. Elliott Wave International has long been the leading analytical house based on Elliott wave theory. They make available a number of free educational materials and other resources, in addition to their for-pay subscriptions.
I recommend two books, both by people associated with EWI.
First, Elliott Wave Principle by Robert Prechter and A.J. Frost is the book that, along with Prechter’s analyses, that created the revival of Elliott wave theory. I first read it in 1984, and it has had a profound influenced on my thinking about markets ever since.
Second, I’ve found Visual Guide to Elliott Wave Trading by Wayne Gorman and Jeffrey Kennedy, both of EWI, to be a useful book that relates Elliott wave theory to practical trading. The authors are hands-on Elliotticians, and for an active trader, that’s exactly what’s needed — less theory and more how-to. The first chapter of the book gives a very nice thumbnail run down of what Elliott wave theory is all about.
Terminology. Here are some links to information about some of the technical jargon I use.
Charts. On my charts, waves have a subscript showing the degree above or below the Intermediate degree. Here are the subscripts and the degree each represents:
- {+3} Supercycle
- {+2} Cycle
- {+1} Primary
- No subscript: Intermediate
- {-1} Minor
- {-2} Minute
- {-3} Minuette
By Tim Bovee, Portland, Oregon, December 23, 2020
Disclaimer
Tim Bovee, Private Trader tracks the analysis and trades of a private trader for his own accounts. Nothing in this blog constitutes a recommendation to buy or sell stocks, options or any other financial instrument. The only purpose of this blog is to provide education and entertainment.
No trader is ever 100 percent successful in his or her trades. Trading in the stock and option markets is risky and uncertain. Each trader must make trading decisions for his or her own account, and take responsibility for the consequences.
License
All content on Tim Bovee, Private Trader by Timothy K. Bovee is licensed under a Creative Commons Attribution-ShareAlike 4.0 International License.
Based on a work at www.timbovee.com.

You must be logged in to post a comment.