3:30 p.m. New York time
Half an hour before the closing bell. We’re ending the year with a seasonally boring session, as the S&P 500 index and its derivatives barely budged. The tiny upward hook at the right extremity of the chart might, just might, be the beginning of wave 5 of Micro degree, which when it is complete, will also mark the end of wave 5 of Subminuette degree and wave 3 of Minuette degree. I’ve updated the chart below.
Happy New Year, fellow traders!
9:50 a.m. New York time
Friday. Markets will be closed globally on Friday for the New Year’s holiday, including New York, London, Tokyo and Sydney.
What’s happening now? The S&P 500 E-mini futures continue a lazy path along the upper boundary of the Diagonal Triangle that began in December 2018 and since then has defined the boundaries of the index’s price perambulations.
What does it mean? It’s a holiday week, so honestly, it means very little. The most recent high was set two days ago at 3747.25. If that’s the end of the upward move that began 10 days ago, then the price will decline, into the 3200s and then, in the winding way of market prices, even lower.
What is the alternative? The price could still go a bit higher, but the upside potential is limited.
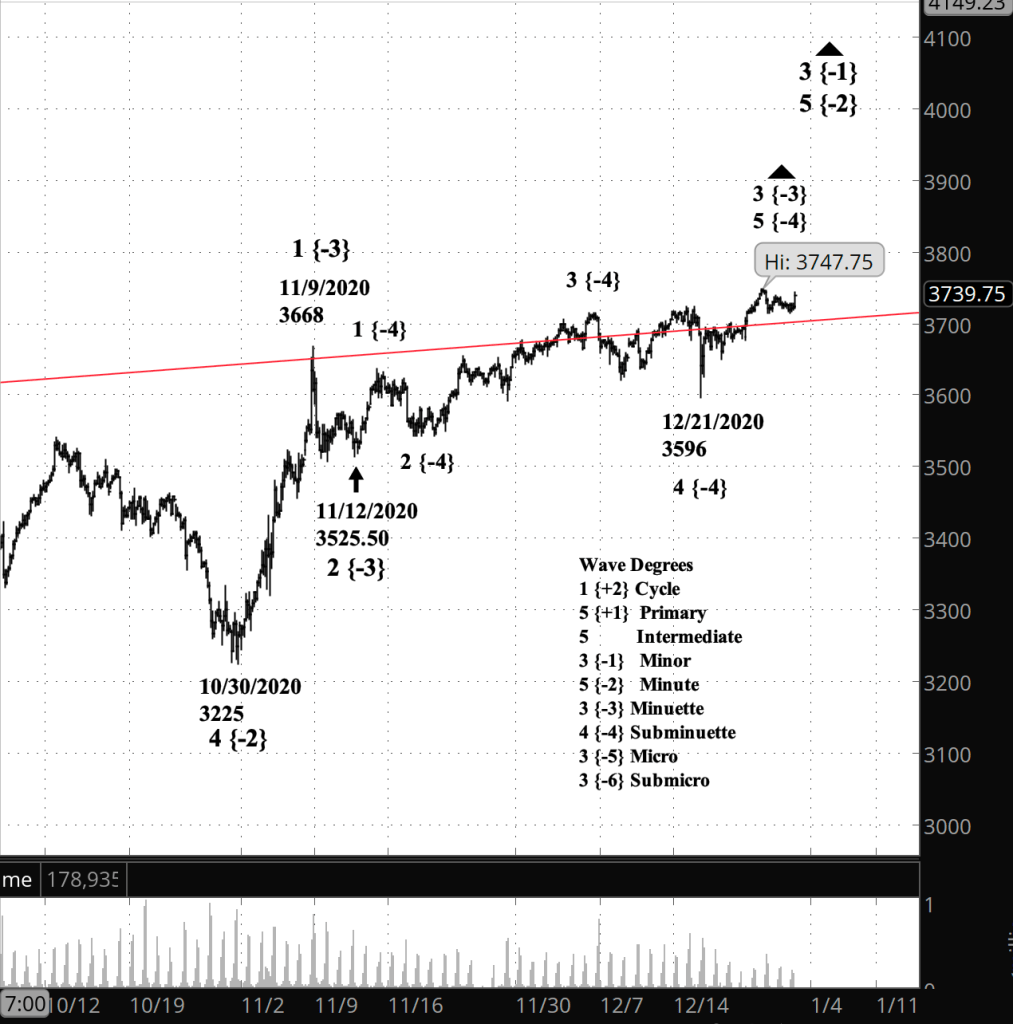
What does Elliott wave theory say? The December 29 high could mark the end of wave 3 of Minuette degree and the subwave 5 of Subminuette degree. It seems more likely to me that the present doldrums is a 4th wave of Micro degree within Subminuette 5, which provides room for a 5th wave rise at the Micro level once the wave 4 correction is complete.
All of that is happening within Primary wave 5 of Intermediate wave 5 of Minor wave 1 of Minute wave 2
Learning and other resources. Elliott Wave International has long been the leading analytical house based on Elliott wave theory. They make available a number of free educational materials and other resources, in addition to their for-pay subscriptions.
I recommend two books, both by people associated with EWI.
First, Elliott Wave Principle by Robert Prechter and A.J. Frost is the book that, along with Prechter’s analyses, that created the revival of Elliott wave theory. I first read it in 1984, and it has had a profound influenced on my thinking about markets ever since.
Second, I’ve found Visual Guide to Elliott Wave Trading by Wayne Gorman and Jeffrey Kennedy, both of EWI, to be a useful book that relates Elliott wave theory to practical trading. The authors are hands-on Elliotticians, and for an active trader, that’s exactly what’s needed — less theory and more how-to. The first chapter of the book gives a very nice thumbnail run down of what Elliott wave theory is all about.
Terminology. Here are some links to information about some of the technical jargon I use.
Charts. On my charts, waves have a subscript showing the degree above or below the Intermediate degree. Here are the subscripts and the degree each represents:
- {+3} Supercycle
- {+2} Cycle
- {+1} Primary
- No subscript: Intermediate
- {-1} Minor
- {-2} Minute
- {-3} Minuette
By Tim Bovee, Portland, Oregon, December 31, 2020
Disclaimer
Tim Bovee, Private Trader tracks the analysis and trades of a private trader for his own accounts. Nothing in this blog constitutes a recommendation to buy or sell stocks, options or any other financial instrument. The only purpose of this blog is to provide education and entertainment.
No trader is ever 100 percent successful in his or her trades. Trading in the stock and option markets is risky and uncertain. Each trader must make trading decisions for his or her own account, and take responsibility for the consequences.
License
All content on Tim Bovee, Private Trader by Timothy K. Bovee is licensed under a Creative Commons Attribution-ShareAlike 4.0 International License.
Based on a work at www.timbovee.com.

You must be logged in to post a comment.