3:30 p.m. New York time
30-minutes before the closing bell. The S&P 500 high set earlier today still stands. I’ve updated the chart, below.
2:05 p.m. New York time
The S&P 500 exceeded the January 4 high, which means that my alternative analysis has come into play. My expectations for subsequent moves, once Minuette wave 3 is complete, are unchanged. I’ve updated the chart.
9:50 a.m. New York time
What’s happening now? The S&P 500 E-mini futures briefly peeked above the upper boundary of the Diagonal Triangle that has traced the course of the index and its derivatives since December 2018. The high, after the closing bell yesterday, was 3734, which is about 40 points below the January 4 turning point.
What does it mean? The S&P 500 is in the early stages of a declining correction that will carry down, probably, to the low 3500s.
What is the alternative? I won’t be entirely confident that the January 4 peak, 3773.25 on the futures, is in fact end of the rise since October 30 until I see the price push below the December 21 low, 3596. Also, even if the correction has has begun, it may well turn out to be a shallow one.
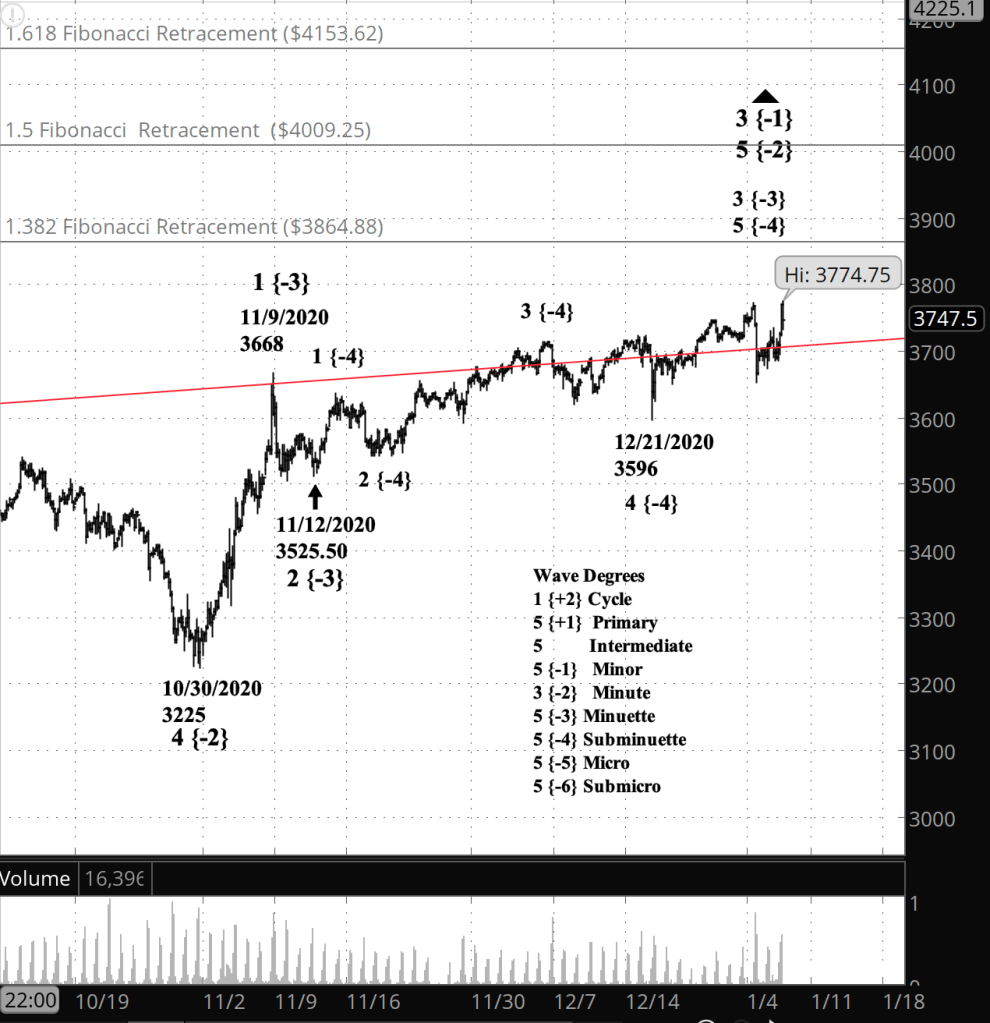
What does Elliott wave theory say? The January 4 peak marked the end of wave 3 of Minuette degree and the beginning of wave A of Subminuette degree within Minuette wave 4. The A wave will typically have five subwaves, at the Micro degree.
All of this is happening within rising wave 5 of Minute degree within rising wave 3 of Minor degree.
Fourth-wave corrections tend to be sideways moves and often will extend into compound patters. Minuette wave 4 may with us for awhile. It will be followed by Minuette wave 4, which may well rise to the 3860s, and as high as the 4150s.
Learning and other resources. Elliott Wave International has long been the leading analytical house based on Elliott wave theory. They make available a number of free educational materials and other resources, in addition to their for-pay subscriptions.
I recommend two books, both by people associated with EWI.
First, Elliott Wave Principle by Robert Prechter and A.J. Frost is the book that, along with Prechter’s analyses, that created the revival of Elliott wave theory. I first read it in 1984, and it has had a profound influenced on my thinking about markets ever since.
Second, I’ve found Visual Guide to Elliott Wave Trading by Wayne Gorman and Jeffrey Kennedy, both of EWI, to be a useful book that relates Elliott wave theory to practical trading. The authors are hands-on Elliotticians, and for an active trader, that’s exactly what’s needed — less theory and more how-to. The first chapter of the book gives a very nice thumbnail run down of what Elliott wave theory is all about.
Terminology. Here are some links to information about some of the technical jargon I use.
Charts. On my charts, waves have a subscript showing the degree above or below the Intermediate degree. Here are the subscripts and the degree each represents:
- {+3} Supercycle
- {+2} Cycle
- {+1} Primary
- No subscript: Intermediate
- {-1} Minor
- {-2} Minute
- {-3} Minuette
By Tim Bovee, Portland, Oregon, January 6, 2021
Disclaimer
Tim Bovee, Private Trader tracks the analysis and trades of a private trader for his own accounts. Nothing in this blog constitutes a recommendation to buy or sell stocks, options or any other financial instrument. The only purpose of this blog is to provide education and entertainment.
No trader is ever 100 percent successful in his or her trades. Trading in the stock and option markets is risky and uncertain. Each trader must make trading decisions for his or her own account, and take responsibility for the consequences.
License
All content on Tim Bovee, Private Trader by Timothy K. Bovee is licensed under a Creative Commons Attribution-ShareAlike 4.0 International License.
Based on a work at www.timbovee.com.

You must be logged in to post a comment.