3:30 p.m. New York time
Half an hour before the closing bell. The S&P 500 E-mini futures continue their downward correction at a small degree. Wave A of Submicro degree is complete and the price is working through Submicro wave B of a three-wave pattern. I’ve updated the chart, below.
I shall continue to hold my losing IWM options, whose last day of trading is Friday, in the hope of a wave C decline on Tuesday.
9:35 a.m. New York time
What’s happening now? The S&P 500 E-mini futures continued to drop from the high of January 8.
What does it mean? The decline marks the first steps in what will likely be a shallow correction that will be followed by another high, and then a significant reversal.
What’s the alternative? If the price reverses today and moves above 3824.50, then the correction has not yet begun. The description of what will follow the correction stands in either case.
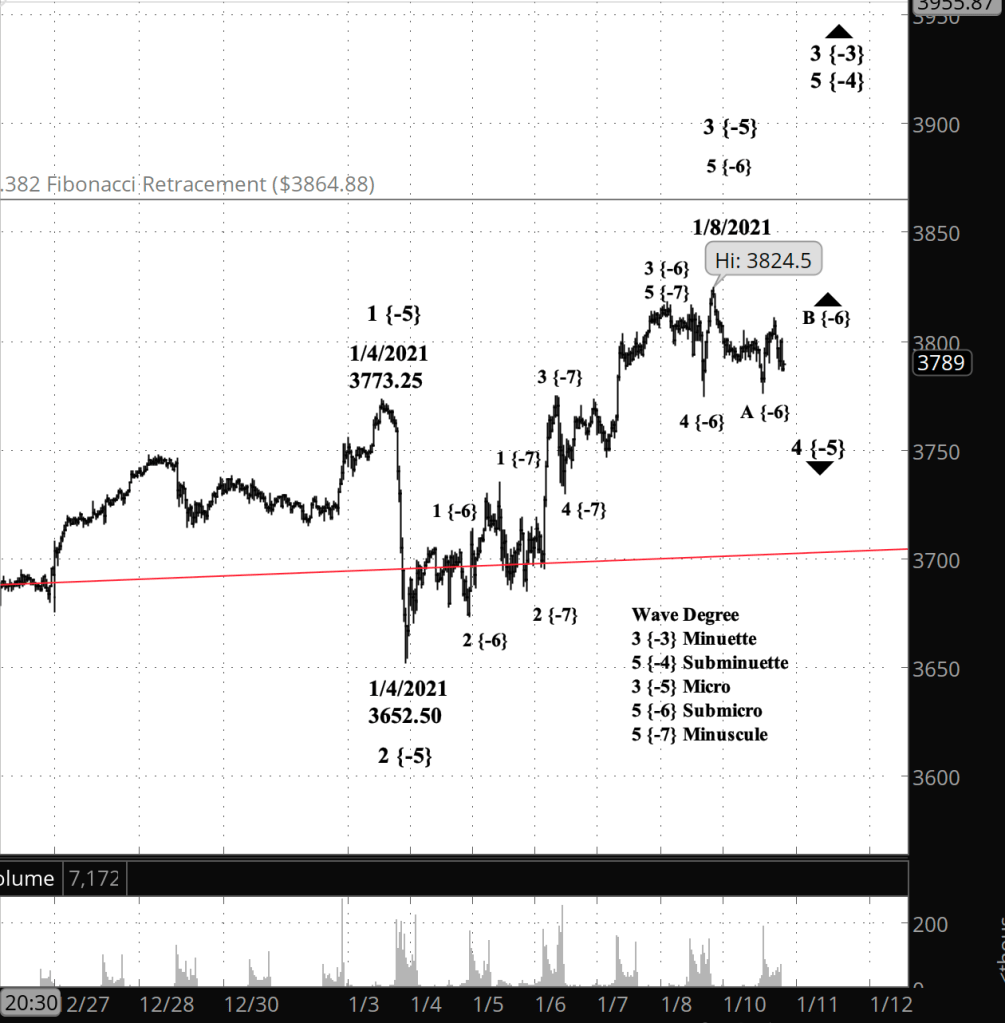
What does Elliott wave theory say? I’ve marked up a near-term chart to trace course of the S&P 500 since late December. The count clearly shows that the January 8 was was the end of wave 3 of Micro degree. Within it, the peak marks the end of wave 5 of the Submicro degree. The correction now underway is a 4th wave of Micro degree. The typical 4th wave is a sideways correction, a Flat pattern in the parlance of Elliott wave analysis, with an internal structure of three wave — A, B and C — each with three subwaves.
My trading strategy. I’ll be looking again at my IWM options and make a decision on whether to exit or hold.
Learning and other resources. Elliott Wave International has long been the leading analytical house based on Elliott wave theory. They make available a number of free educational materials and other resources, in addition to their for-pay subscriptions.
I recommend two books, both by people associated with EWI.
First, Elliott Wave Principle by Robert Prechter and A.J. Frost is the book that, along with Prechter’s analyses, that created the revival of Elliott wave theory. I first read it in 1984, and it has had a profound influenced on my thinking about markets ever since.
Second, I’ve found Visual Guide to Elliott Wave Trading by Wayne Gorman and Jeffrey Kennedy, both of EWI, to be a useful book that relates Elliott wave theory to practical trading. The authors are hands-on Elliotticians, and for an active trader, that’s exactly what’s needed — less theory and more how-to. The first chapter of the book gives a very nice thumbnail run down of what Elliott wave theory is all about.
Terminology. Here are some links to information about some of the technical jargon I use.
Charts. On my charts, waves have a subscript showing the degree above or below the Intermediate degree. Here are the subscripts and the degree each represents:
- {+3} Supercycle
- {+2} Cycle
- {+1} Primary
- No subscript: Intermediate
- {-1} Minor
- {-2} Minute
- {-3} Minuette
By Tim Bovee, Portland, Oregon, January 11, 2021
Disclaimer
Tim Bovee, Private Trader tracks the analysis and trades of a private trader for his own accounts. Nothing in this blog constitutes a recommendation to buy or sell stocks, options or any other financial instrument. The only purpose of this blog is to provide education and entertainment.
No trader is ever 100 percent successful in his or her trades. Trading in the stock and option markets is risky and uncertain. Each trader must make trading decisions for his or her own account, and take responsibility for the consequences.
License
All content on Tim Bovee, Private Trader by Timothy K. Bovee is licensed under a Creative Commons Attribution-ShareAlike 4.0 International License.
Based on a work at www.timbovee.com.

You must be logged in to post a comment.