3:30 p.m. New York time
Half an hour before the closing bell. The S&P 500 hit a high for the day at midday, of 3835.75 on the E-mini futures, and has remained at close to that level up to the present. I’ve updated the chart below.
1:10 p.m. New York time
I’ve posted an Elliott wave analysis of GME. Fun while it lasted.
11 a.m. New York time
What’s happening now? The S&P 500 E-mini futures continued to rise in overnight trading, exceeding the high of January 28 as it continues an upward correction within the downtrend that began on January 26.
What does it mean? The move above the January 28 high eliminates any probability that the correction has been completed. The present rise is most likely the final wave of the correction. It will be followed by a powerful push to the downside.
What are the alternatives? If the price pushes above 3862.25, the high of January 26, then the downtrend is in fact a correction within the uptrend that began on February 23, 2020.
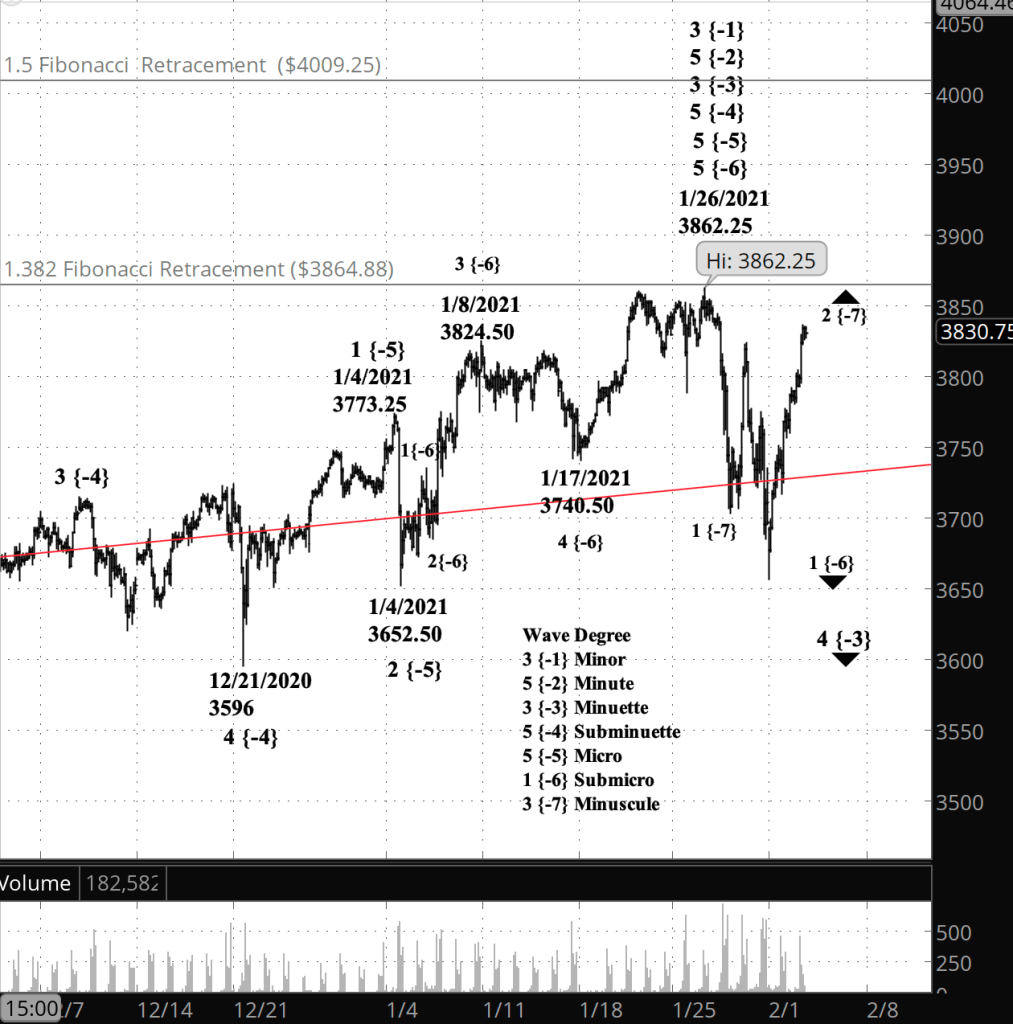
What does Elliott wave theory say? The higher high set in overnight trading is wave C of Subminuscule degree within wave 2 of Minuscule degree. We’re talking very small patterns here, yet in Elliott wave analysis, large patterns are built from increasingly smaller patterns, with all degrees following the same rules.
The end of Minuscule wave 2 will be followed by Minuscule 3 to the downside, which will be powerful enough at that small degree to leave no doubt that the trend is down. This is all happening within Submicro wave 1 and is a part of the much larger wave 4 of Minuette degree.
Learning and other resources. Elliott Wave International has long been the leading analytical house based on Elliott wave theory. They make available a number of free educational materials and other resources, in addition to their for-pay subscriptions.
I recommend two books, both by people associated with EWI.
First, Elliott Wave Principle by Robert Prechter and A.J. Frost is the book that, along with Prechter’s analyses, that created the revival of Elliott wave theory. I first read it in 1984, and it has had a profound influenced on my thinking about markets ever since.
Second, I’ve found Visual Guide to Elliott Wave Trading by Wayne Gorman and Jeffrey Kennedy, both of EWI, to be a useful book that relates Elliott wave theory to practical trading. The authors are hands-on Elliotticians, and for an active trader, that’s exactly what’s needed — less theory and more how-to. The first chapter of the book gives a very nice thumbnail run down of what Elliott wave theory is all about.
Terminology. Here are some links to information about some of the technical jargon I use.
Charts. On my charts, waves have a subscript showing the degree above or below the Intermediate degree. Here are the subscripts and the degree each represents:
- {+3} Supercycle
- {+2} Cycle
- {+1} Primary
- No subscript: Intermediate
- {-1} Minor
- {-2} Minute
- {-3} Minuette
- {-4} Subminuette
- {-5} Micro
- {-6} Submicro
- {-7} Minuscule
By Tim Bovee, Portland, Oregon, February 2, 2021
Disclaimer
Tim Bovee, Private Trader tracks the analysis and trades of a private trader for his own accounts. Nothing in this blog constitutes a recommendation to buy or sell stocks, options or any other financial instrument. The only purpose of this blog is to provide education and entertainment.
No trader is ever 100 percent successful in his or her trades. Trading in the stock and option markets is risky and uncertain. Each trader must make trading decisions for his or her own account, and take responsibility for the consequences.
License
All content on Tim Bovee, Private Trader by Timothy K. Bovee is licensed under a Creative Commons Attribution-ShareAlike 4.0 International License.
Based on a work at www.timbovee.com.

You must be logged in to post a comment.