4:30 p.m. New York time
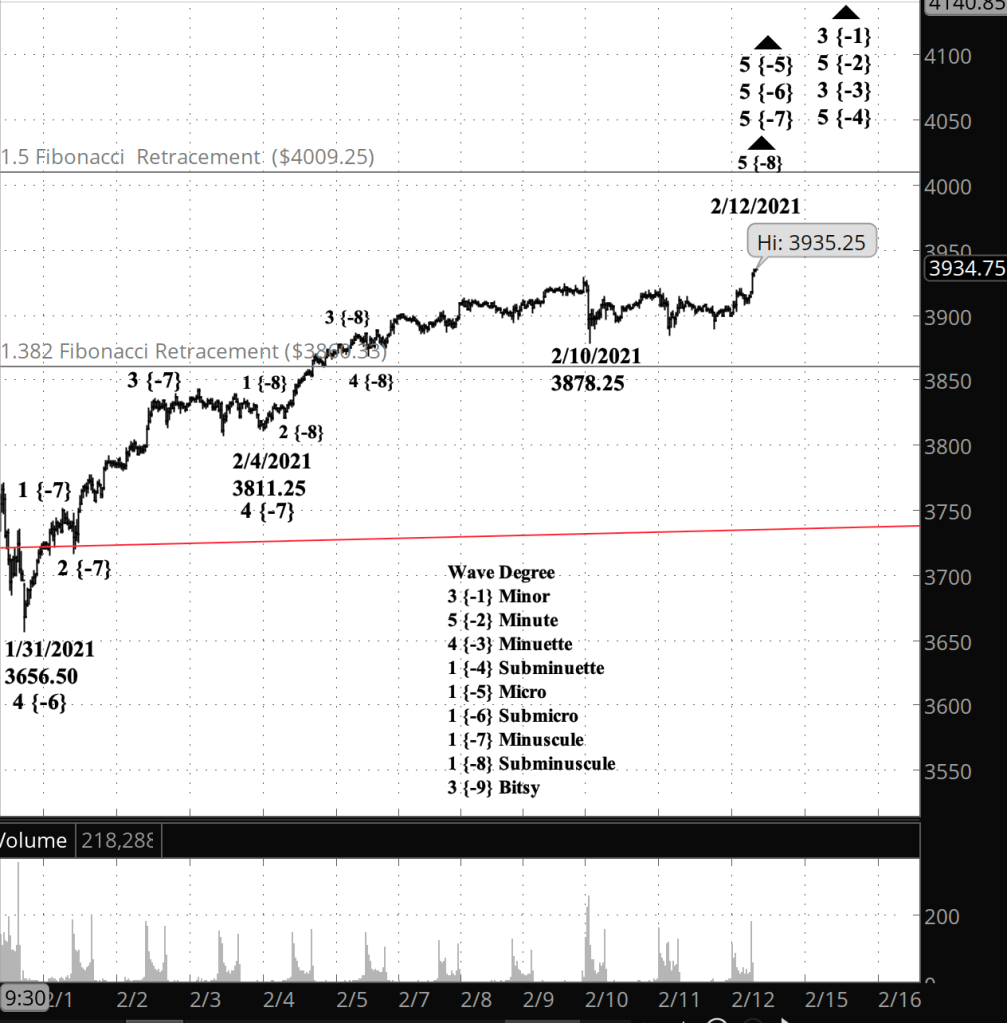
After the closing bell. A rapid rise in the last 20 minutes of trading carried the S&P 500 to a new high, 3935.25 on the futures and 3937.23 on the index, refuting my principle analysis and confirming the alternative. The rise that began January 31 is still underway. I’ve updated the chart.
3:30 p.m. New York time
Half an hour before the closing bell. The S&P 500 traded close to its opening price throughout the day. I’ve updated the chart.
9:35 a.m. New York time
What’s happening now? The S&P 500 E-mini futures continued to trade around 25-30 points below the high of 3928.50 attained on February 10. The equivalent high on the index is 3931.50.
What does it mean? My analysis is unchanged from yesterday. The February 10 peak was the end of the rise from January 31, and subsequent so-far-shallow decline is the first steps toward what will turn into a significant downtrend.
What are the alternatives? Although the February 10 peak satisfies all requirements in Elliott for completion of the rise, it is possible that there will be a final bump upward before the downtrend begins.
What does Elliott wave theory say? The decline so far is wave 1 of Subminuette degree, perhaps. I always find it impossible in the early stages of a trend change to determine precisely which degree I’m tracking. The decline so far lacks context.
The high of February 10 marked the endpoint of wave 5 of Submicro degree and cascades up the parent waves to wave 5 of Subminuette degree, which began December 21, 2020 from 3596. Up one degree, it is the end of wave 3 of Minuette degree, which began November 12, 2020 from 3525.50.
Learning and other resources. Elliott Wave International has long been the leading analytical house based on Elliott wave theory. They make available a number of free educational materials and other resources, in addition to their for-pay subscriptions.
I recommend two books, both by people associated with EWI.
First, Elliott Wave Principle by Robert Prechter and A.J. Frost is the book that, along with Prechter’s analyses, that created the revival of Elliott wave theory. I first read it in 1984, and it has had a profound influenced on my thinking about markets ever since.
Second, I’ve found Visual Guide to Elliott Wave Trading by Wayne Gorman and Jeffrey Kennedy, both of EWI, to be a useful book that relates Elliott wave theory to practical trading. The authors are hands-on Elliotticians, and for an active trader, that’s exactly what’s needed — less theory and more how-to. The first chapter of the book gives a very nice thumbnail run down of what Elliott wave theory is all about.
Terminology. Here are some links to information about some of the technical jargon I use.
Charts. On my charts, waves have a subscript showing the degree above or below the Intermediate degree. Here are the subscripts and the degree each represents:
- {+3} Supercycle
- {+2} Cycle
- {+1} Primary
- No subscript: Intermediate
- {-1} Minor
- {-2} Minute
- {-3} Minuette
- {-4} Subminuette
- {-5} Micro
- {-6} Submicro
- {-7} Minuscule
By Tim Bovee, Portland, Oregon, February 12, 2021
Disclaimer
Tim Bovee, Private Trader tracks the analysis and trades of a private trader for his own accounts. Nothing in this blog constitutes a recommendation to buy or sell stocks, options or any other financial instrument. The only purpose of this blog is to provide education and entertainment.
No trader is ever 100 percent successful in his or her trades. Trading in the stock and option markets is risky and uncertain. Each trader must make trading decisions for his or her own account, and take responsibility for the consequences.
License
All content on Tim Bovee, Private Trader by Timothy K. Bovee is licensed under a Creative Commons Attribution-ShareAlike 4.0 International License.
Based on a work at www.timbovee.com.

You must be logged in to post a comment.