3:30 a.m. New York time
Half an hour before the closing bell. The S&P 500 completed the declining wave 1 of Subminuscule degree, at 3880.50 on the futures and 3885.03 on the index, and then reversed to the upside as it began a 2nd wave correction. Second waves tend to retrace much of the distance traveled by the preceding 1st wave, which began its decline from 3959.25. I’ve updated the chart.
10 a.m. New York time
What’s happening now? The S&P 500 E-mini futures continued their decline from the February 15 high, 3959.25, entering the final phase before an upward correction that, if it’s typical, will retrace much of that decline while remaining below the peak.
What does it mean? Under my principle analysis, the fall that began on February 15 is the beginning of a major decline. Declines begin small and expand their reach, except during panics, such as the rapid decline of a year ago. (See the long-term chart posted yesterday.) So after the present decline and the retracement that will follow, the price will resume its decline, following the same pattern we’ve seen so far: A five-wave decline, an upward correction, and another five-wave decline, with each decline wave internally showing a similar five-wave pattern. Ultimately, the price will reach into the 2000s.
What are the alternatives? It is possible to reach the chart to mean that the decline from February 15 is a correction and not the beginning of a downtrend. If that’s the case, the next move will likely be to the upside, just as with the principle analysis, but it will exceed the February 15 peak.
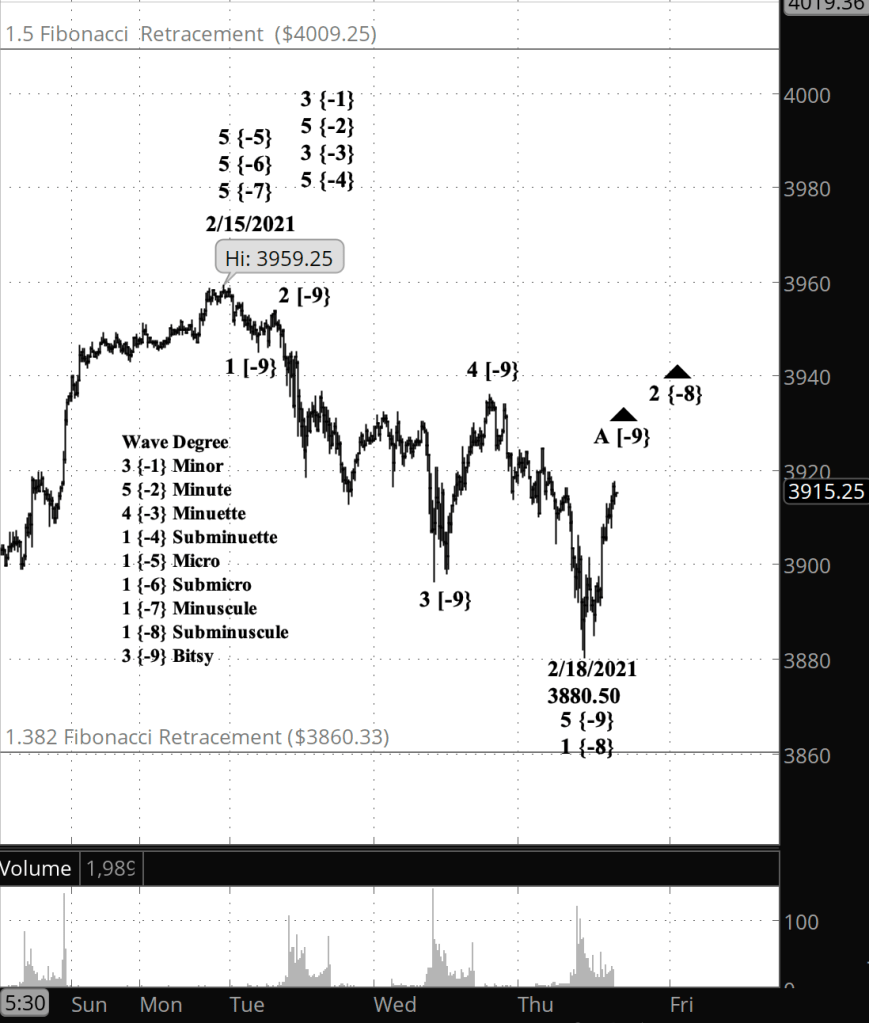
What does Elliott wave theory say? Under the principle analysis, the S&P 500 is in wave 1 of Subminuscule degree and within it, wave 5 of Bitsy degree, very small degrees indeed. Walking upward, Subminuscule 1 is a subwave nested within a series of 1st wave of increasingly higher degree. On the chart I’ve labeled the Bitsy degree with numbers, 1 through 5, as is the convention for movements in the direction of the direction of the trend.
Under the alternative count, the wave Bitsy wave 3 (labelled 3 {-9}) becomes Bitsy wave A of a downward correction, Bitsy 4 is wave B, and the present decline, labelled wave 5, is wave C, the final wave of the correction. The next move up under this scenario would resume the upward movement with five numbered waves to the upside.
The decision point is the peak, 3959.25 on the futures, 3950.43 on the index. The price will rise under both the principle and alternative scenarios. If the coming rise is a correction, the price will remain below the peak. If it’s a resumption of the uptrend, it will break above the peak.
Learning and other resources. Elliott Wave International has long been the leading analytical house based on Elliott wave theory. They make available a number of free educational materials and other resources, in addition to their for-pay subscriptions.
I recommend two books, both by people associated with EWI.
First, Elliott Wave Principle by Robert Prechter and A.J. Frost is the book that, along with Prechter’s analyses, that created the revival of Elliott wave theory. I first read it in 1984, and it has had a profound influenced on my thinking about markets ever since.
Second, I’ve found Visual Guide to Elliott Wave Trading by Wayne Gorman and Jeffrey Kennedy, both of EWI, to be a useful book that relates Elliott wave theory to practical trading. The authors are hands-on Elliotticians, and for an active trader, that’s exactly what’s needed — less theory and more how-to. The first chapter of the book gives a very nice thumbnail run down of what Elliott wave theory is all about.
Terminology. Here are some links to information about some of the technical jargon I use.
Charts. On my charts, waves have a subscript showing the degree above or below the Intermediate degree. Here are the subscripts and the degree each represents:
- {+3} Supercycle
- {+2} Cycle
- {+1} Primary
- No subscript: Intermediate
- {-1} Minor
- {-2} Minute
- {-3} Minuette
- {-4} Subminuette
- {-5} Micro
- {-6} Submicro
- {-7} Minuscule
By Tim Bovee, Portland, Oregon, February 18, 2021
Disclaimer
Tim Bovee, Private Trader tracks the analysis and trades of a private trader for his own accounts. Nothing in this blog constitutes a recommendation to buy or sell stocks, options or any other financial instrument. The only purpose of this blog is to provide education and entertainment.
No trader is ever 100 percent successful in his or her trades. Trading in the stock and option markets is risky and uncertain. Each trader must make trading decisions for his or her own account, and take responsibility for the consequences.
License
All content on Tim Bovee, Private Trader by Timothy K. Bovee is licensed under a Creative Commons Attribution-ShareAlike 4.0 International License.
Based on a work at www.timbovee.com.

You must be logged in to post a comment.