3:30 p.m. New York time
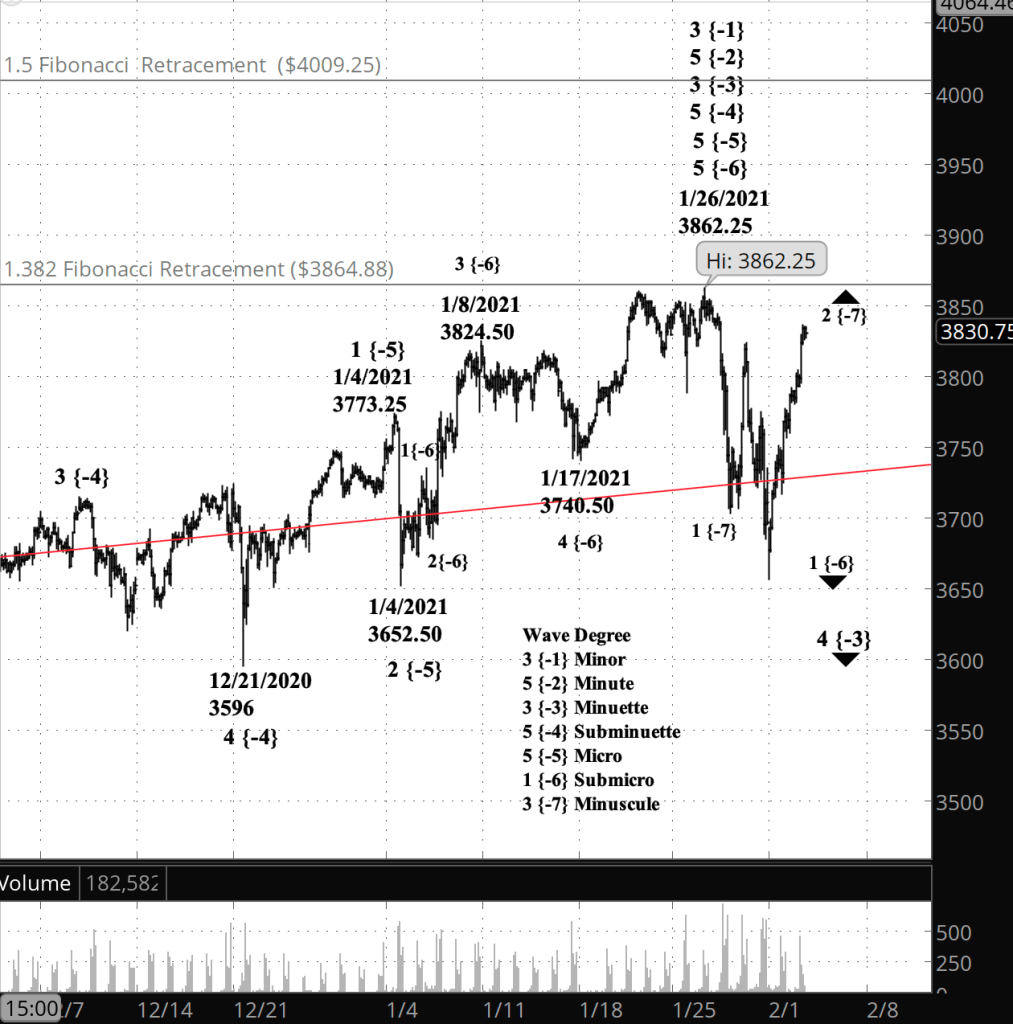
Half an hour before the closing bell. The S&P 500 hit a high for the day at midday, of 3835.75 on the E-mini futures, and has remained at close to that level up to the present. I’ve updated the chart below.
1:10 p.m. New York time
I’ve posted an Elliott wave analysis of GME. Fun while it lasted.
11 a.m. New York time
What’s happening now? The S&P 500 E-mini futures continued to rise in overnight trading, exceeding the high of January 28 as it continues an upward correction within the downtrend that began on January 26.
What does it mean? The move above the January 28 high eliminates any probability that the correction has been completed. The present rise is most likely the final wave of the correction. It will be followed by a powerful push to the downside.
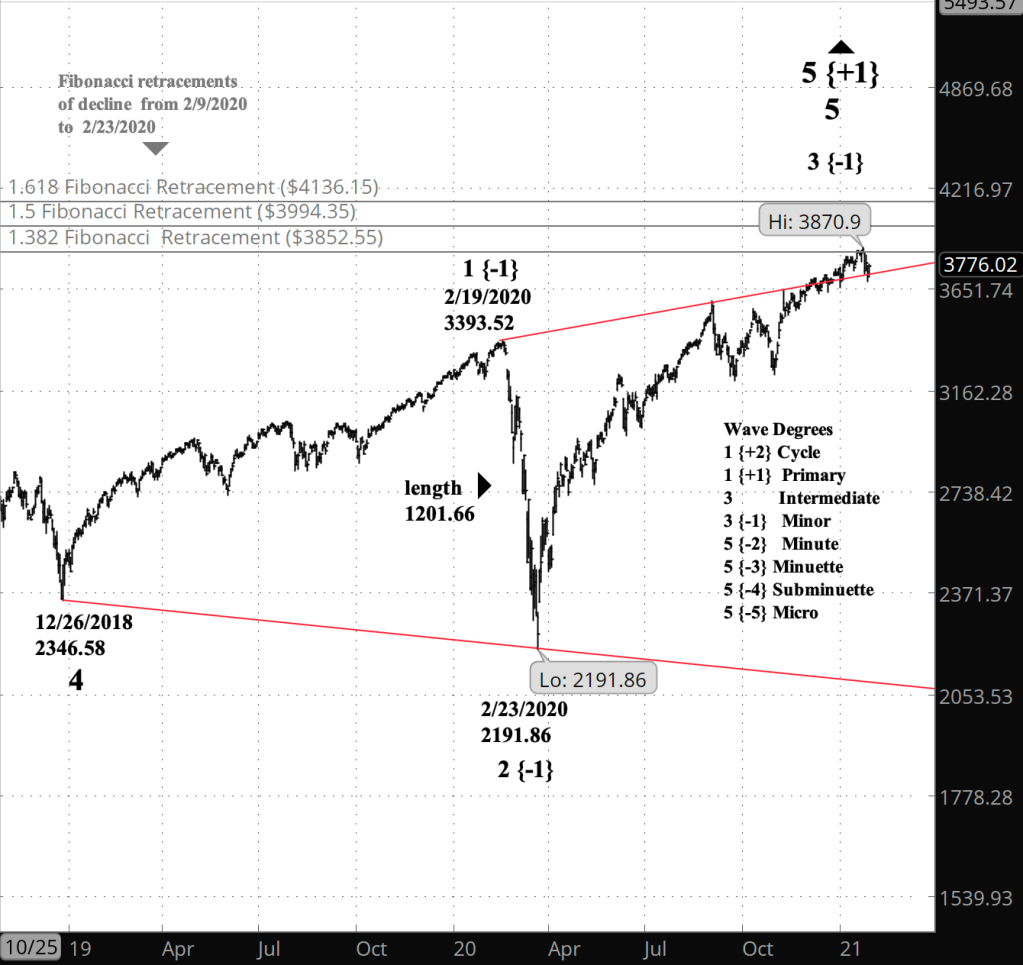
What are the alternatives? If the price pushes above 3862.25, the high of January 26, then the downtrend is in fact a correction within the uptrend that began on February 23, 2020.
What does Elliott wave theory say? The higher high set in overnight trading is wave C of Subminuscule degree within wave 2 of Minuscule degree. We’re talking very small patterns here, yet in Elliott wave analysis, large patterns are built from increasingly smaller patterns, with all degrees following the same rules.
The end of Minuscule wave 2 will be followed by Minuscule 3 to the downside, which will be powerful enough at that small degree to leave no doubt that the trend is down. This is all happening within Submicro wave 1 and is a part of the much larger wave 4 of Minuette degree.
Read More »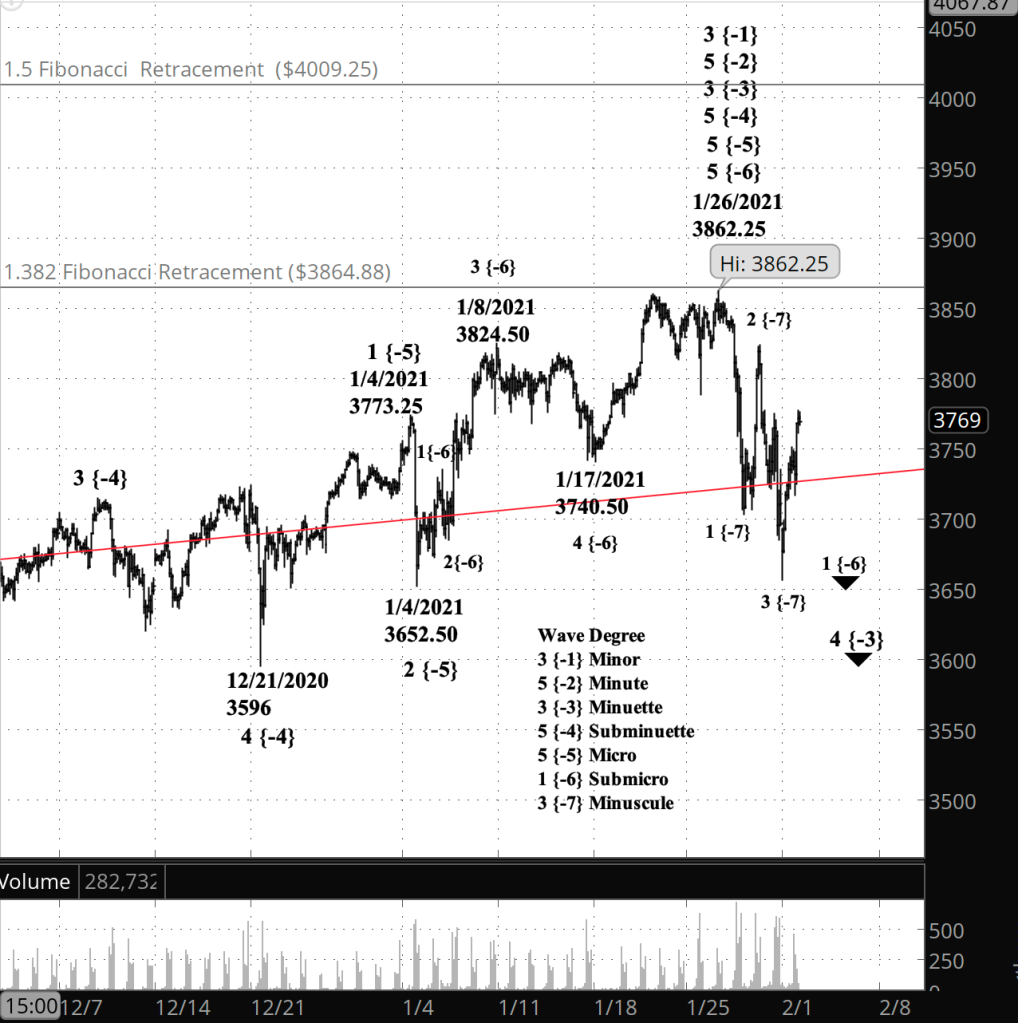

You must be logged in to post a comment.