3:30 p.m. New York time
Half an hour before the closing bell. The S&P 500s moved past the upper boundary of a channel for the Subminuscule degree (blue line) and then dropped back into the channel, perhaps signaling, although not for a certainty, an end to the final wave of the upward correction. If that is indeed a valid signal, then the Subminuscule 5th wave has begun, with a target somewhere below 3720.50 on the futures. I’ve updated the chart below. The price remains above the upper boundary of the Diagonal Triangle that began in December 2018 (red line).
9:50 a.m. New York time
What’s happening now? The S&P 500 E-mini futures continued their upward correction, entering the final portion of the three-wave pattern.
What does it mean? Completion of the pattern opens two possibilities. The first is that the correction comes to an end with that their wave.
What are the alternatives? The alternative is that the correction extends with the addition of a second pattern.
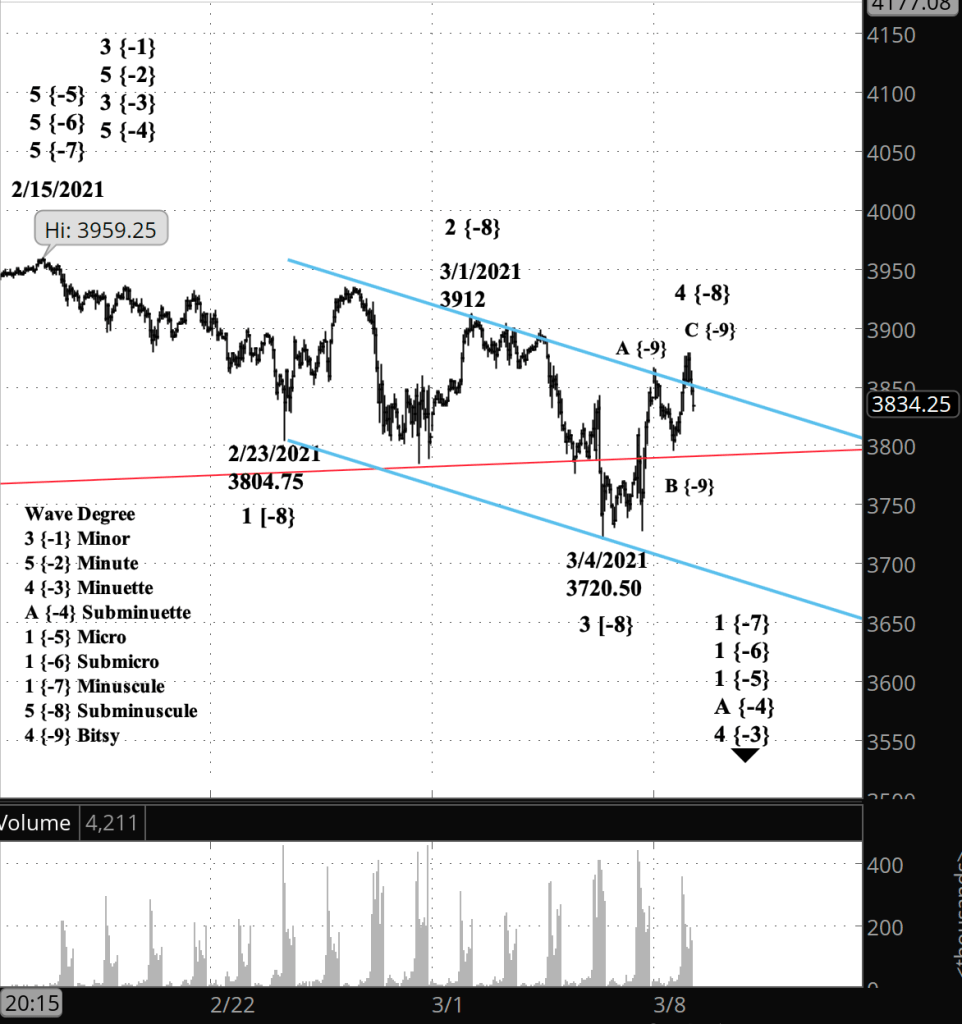
What does Elliott wave theory say? The correction is wave 4 of Subminuscule degree, and within it, wave C of Bitsy degree began today in overnight trading. Under my principle analysis, the end of wave C will also end its parent wave 4, and wave 5 of Subminuscule will resume the downtrend that began February 15 from 3959.25, moving below 3720.50, perhaps significantly below that level. Under my alternative analysis, wave C of Bitsy degree will be followed by an X wave, which will separate the just completed corrective pattern from a corrective pattern that will follow. In this alternative case, the following pattern can be a shallow Flat or a more directional Zigzag. There’s no way to tell at this point.
Learning and other resources. Elliott Wave International has long been the leading analytical house based on Elliott wave theory. They make available a number of free educational materials and other resources, in addition to their for-pay subscriptions.
I recommend two books, both by people associated with EWI.
First, Elliott Wave Principle by Robert Prechter and A.J. Frost is the book that, along with Prechter’s analyses, that created the revival of Elliott wave theory. I first read it in 1984, and it has had a profound influenced on my thinking about markets ever since.
Second, I’ve found Visual Guide to Elliott Wave Trading by Wayne Gorman and Jeffrey Kennedy, both of EWI, to be a useful book that relates Elliott wave theory to practical trading. The authors are hands-on Elliotticians, and for an active trader, that’s exactly what’s needed — less theory and more how-to. The first chapter of the book gives a very nice thumbnail run down of what Elliott wave theory is all about.
Terminology. Here are some links to information about some of the technical jargon I use.
Charts. On my charts, waves have a subscript showing the degree above or below the Intermediate degree. Here are the subscripts and the degree each represents:
- {+3} Supercycle
- {+2} Cycle
- {+1} Primary
- No subscript: Intermediate
- {-1} Minor
- {-2} Minute
- {-3} Minuette
- {-4} Subminuette
- {-5} Micro
- {-6} Submicro
- {-7} Minuscule
- {-8} Subminuscule
- {-9} Bitsy
- {-10} Subbitsy
By Tim Bovee, Portland, Oregon, March 8, 2021
Disclaimer
Tim Bovee, Private Trader tracks the analysis and trades of a private trader for his own accounts. Nothing in this blog constitutes a recommendation to buy or sell stocks, options or any other financial instrument. The only purpose of this blog is to provide education and entertainment.
No trader is ever 100 percent successful in his or her trades. Trading in the stock and option markets is risky and uncertain. Each trader must make trading decisions for his or her own account, and take responsibility for the consequences.
License
All content on Tim Bovee, Private Trader by Timothy K. Bovee is licensed under a Creative Commons Attribution-ShareAlike 4.0 International License.
Based on a work at www.timbovee.com.

You must be logged in to post a comment.