3:30 p.m. New York time
Half an hour before the closing bell. No change from the 2:10 p.m. analysis. I’ve updated the chart.
2:10 p.m. New York time
Two hours before the closing bell. The S&P 500 E-mini futures reversed at a low of 3875, which is 26.25 points below the end of wave 1 of Subminuscule degree, 3901.25, and moved back above that level. The S&P 500 index never fell below the end of Subminuscule 1. So this confirms my rounding-error theory for the futures, as discussed below the the Elliott wave theory section, and enables me to reanalyze the chart.
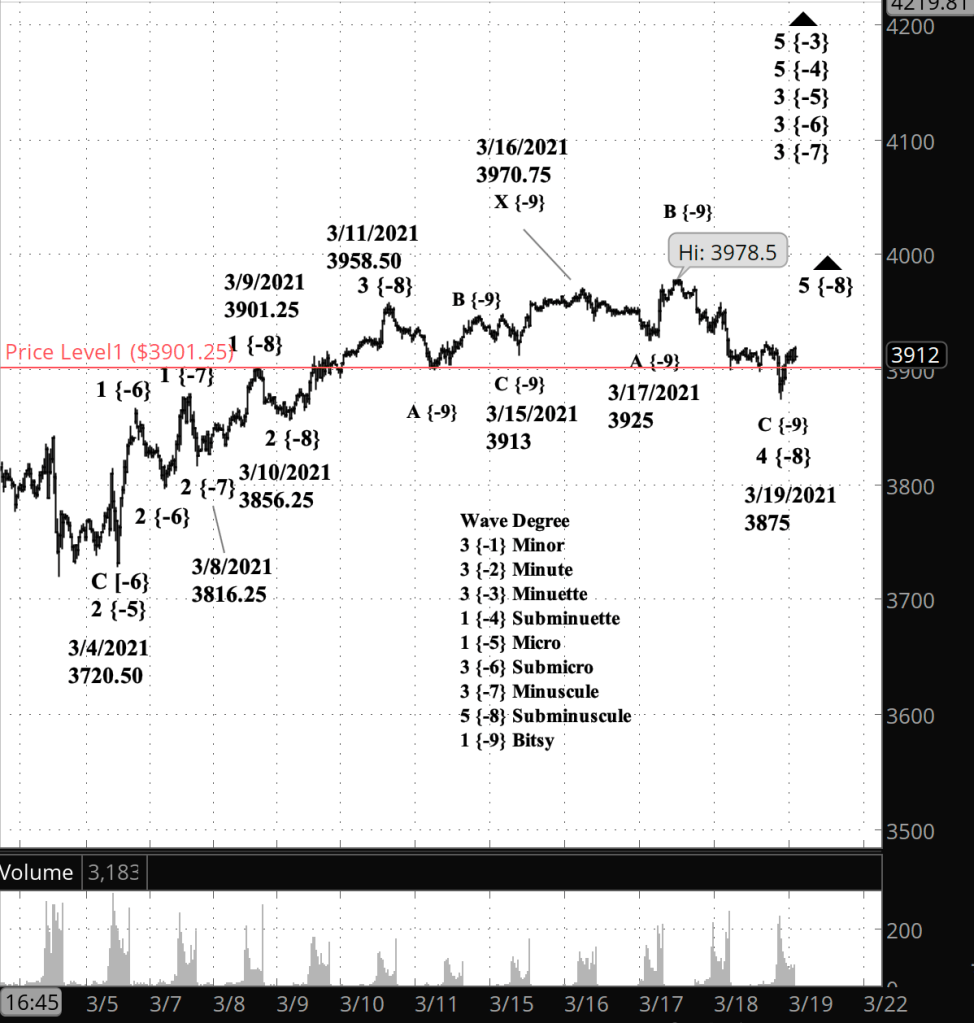
Under my principle analysis, wave 4 of Subminuscule degree ended today at 3875, and the reversal to the upside is wave 5 of Subminuscule degree. The rules of Elliott wave analysis impose no limits, beyond common sense, on the distance a 5th wave can travel. The end of Subminuscule 5 will also mark the end of the parent wave, 3 of Minuscule degree, which will trigger a correction of the rise from 3816.25, which began on March 8.
The alternate analysis designates the rise today as an additional separator, wave X of subminuscule degree, to be followed by another corrective pattern that will probably trend sideways. And a third possibility is that Wave C of Bitsy degree is still declining, although I consider this to be unlikely.
10:10 a.m. New York time
Update. The S&P 500 index 4th wave of Minuscule degree has not penetrated the end of the prior wave 1. The 1st wave ended at 3878.07 on the index, and the low so far of wave 4 is 3886.75. This lends weight to my rounding-error theory.
9:55 a.m. New York time
What’s happening now? The S&P 500 E-mini futures traded sideways overnight as the downward correction that began March 11 continues.
What does it mean? But there’s a potential problem with the count, one that I’m unable to resolve at present.
What’s the alternative? See the Elliott wave theory section below.
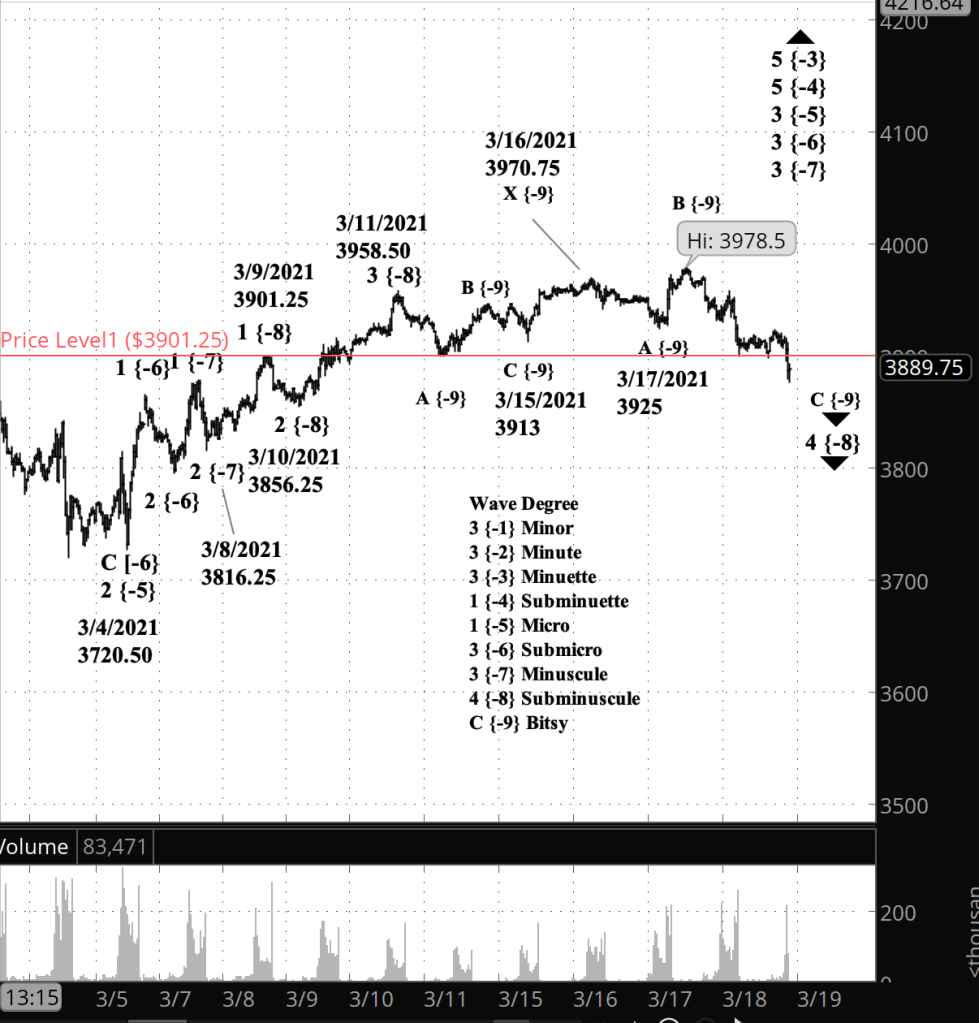
What does Elliott wave theory say? The problem is this. It’s a firm rule in Elliott wave analysis that a 4th wave cannot move beyond the end of the preceding 1st wave. I’ve counted the present decline as the 4th wave of Subminuscule degree. The 1st wave of Subminuscule degree ended at 3901.25 (the red horizontal line on the chart)_. The price has moved below that level in three 35-minute bars since yesterday, always briefly, as it quickly retreats to above the level. In the last hour as I write this the price has penetrated that level in two bars, the most recent reaching a low of 3877.25 (so far).
So what make of this? There are several possibilities, none of which I find especially compelling. The first is the granularity of futures pricing. The S&P 500 index is priced in cents, 1/100th of a dollar. The futures are priced in 25 cent increments, 1/4th of a dollar. The rule forbidding a 4th wave move beyond the end of wave 3 says “never”, but it was written for the index, before the futures had even been invented. So it could be that the moves below the line amount to a rounding error. After all, the largest push below that level has been 24 cents, and the rounding error will continue as low as 50 cents below the end of wave 1.
If we stick to “never means never”, then the alternative is the severely truncated 3rd wave model that I discussed in detail in yesterday’s analysis. In brief, I wrote that a short wave 3 ending at 3978.50 means that the future 5th wave must even shorter to avoid the 3rd wave being shorter than both waves 1 and 5. That’s another forbidden structure under the rules of Elliott wave analysis.
At this point I’m throwing up my hands and quietly sipping my Bancha green tea until the chart gains some clarity. As the Martian-raised Earthling Valentine Michael Smith put it in Robert Heinlein’s masterpiece Stranger in a Strange Land, “Waiting is.”
Learning and other resources. Elliott Wave International has long been the leading analytical house based on Elliott wave theory. They make available a number of free educational materials and other resources, in addition to their for-pay subscriptions.
I recommend two books, both by people associated with EWI.
First, Elliott Wave Principle by Robert Prechter and A.J. Frost is the book that, along with Prechter’s analyses, that created the revival of Elliott wave theory. I first read it in 1984, and it has had a profound influenced on my thinking about markets ever since.
Second, I’ve found Visual Guide to Elliott Wave Trading by Wayne Gorman and Jeffrey Kennedy, both of EWI, to be a useful book that relates Elliott wave theory to practical trading. The authors are hands-on Elliotticians, and for an active trader, that’s exactly what’s needed — less theory and more how-to. The first chapter of the book gives a very nice thumbnail run down of what Elliott wave theory is all about.
Terminology. Here are some links to information about some of the technical jargon I use.
Charts. On my charts, waves have a subscript showing the degree above or below the Intermediate degree. Here are the subscripts and the degree each represents:
- {+3} Supercycle
- {+2} Cycle
- {+1} Primary
- No subscript: Intermediate
- {-1} Minor
- {-2} Minute
- {-3} Minuette
- {-4} Subminuette
- {-5} Micro
- {-6} Submicro
- {-7} Minuscule
- {-8} Subminuscule
- {-9} Bitsy
- {-10} Subbitsy
By Tim Bovee, Portland, Oregon, March xx, 2021
Disclaimer
Tim Bovee, Private Trader tracks the analysis and trades of a private trader for his own accounts. Nothing in this blog constitutes a recommendation to buy or sell stocks, options or any other financial instrument. The only purpose of this blog is to provide education and entertainment.
No trader is ever 100 percent successful in his or her trades. Trading in the stock and option markets is risky and uncertain. Each trader must make trading decisions for his or her own account, and take responsibility for the consequences.
License
All content on Tim Bovee, Private Trader by Timothy K. Bovee is licensed under a Creative Commons Attribution-ShareAlike 4.0 International License.
Based on a work at www.timbovee.com.

You must be logged in to post a comment.