3:30 p.m. New York time
Half an hour before the closing bell. The S&P 500 continued trading in a very narrow range. No change in the analysis. Chart updated.
10:35 a.m. New York time
What’s happening now? The S&P 500 E-mini futures completed their sideways correction in overnight trading, reaching higher to 4092.75 as they began the final leg of the rise that began on March 25.
What does it mean? The rise from March 25 is still underway. When complete, a larger, still shallow, correction will begin.
What are the alternatives? The correction that began a few days ago could be underway, perhaps extending into a compound structure with several corrective patterns linked together.
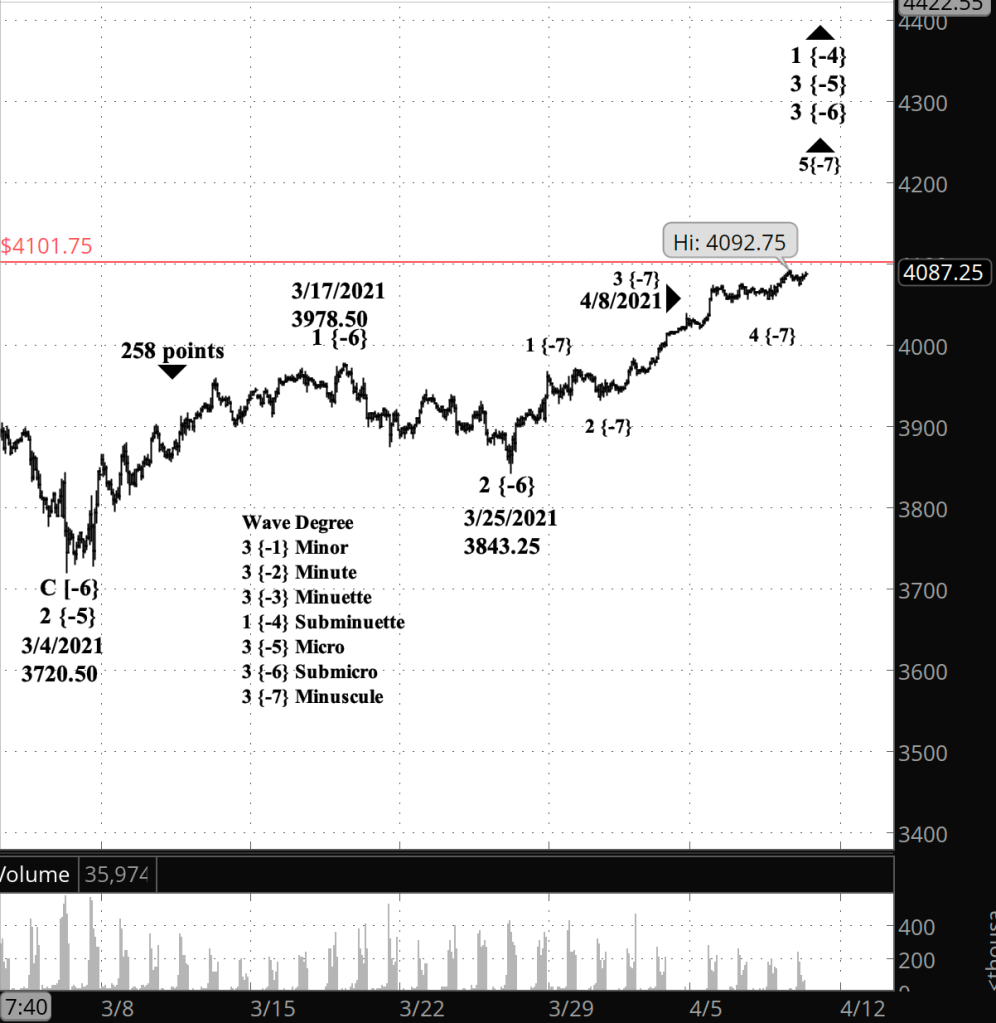
What does Elliott wave theory say? Under the principle analysis, wave 4 of Minuscule degree reached its end early this morning, before the opening bell, and began Minuscule wave 5, the final wave of the rise that began March 25. Completion of Minuscule 5 will also mark the end of the parent, wave 3 of Submicro degree, which will be followed by a 4th wave correction.
As noted in yesterday’s analysis, if Minuscule wave 5 moves above the 4101.75 level (the red line), then Submicro wave 3 will be longer than its preceding 1st wave of the same degree, which covered 258 points beginning to end.
Under the alternative analysis, Minuscule wave 4 is still underway. The early morning high under this scenario coulding a connecting X wave in a compounder correction with two corrective patterns.
The low within Minuscule wave 4 was 4056.50. If the price should dip beneath that level, then I would consider the alternative analysis to be correct.
Learning and other resources. Elliott Wave International has long been the leading analytical house based on Elliott wave theory. They make available a number of free educational materials and other resources, in addition to their for-pay subscriptions.
I recommend two books, both by people associated with EWI.
First, Elliott Wave Principle by Robert Prechter and A.J. Frost is the book that, along with Prechter’s analyses, that created the revival of Elliott wave theory. I first read it in 1984, and it has had a profound influenced on my thinking about markets ever since.
Second, I’ve found Visual Guide to Elliott Wave Trading by Wayne Gorman and Jeffrey Kennedy, both of EWI, to be a useful book that relates Elliott wave theory to practical trading. The authors are hands-on Elliotticians, and for an active trader, that’s exactly what’s needed — less theory and more how-to. The first chapter of the book gives a very nice thumbnail run down of what Elliott wave theory is all about.
Terminology. Here are some links to information about some of the technical jargon I use.
Charts. On my charts, waves have a subscript showing the degree above or below the Intermediate degree. Here are the subscripts and the degree each represents:
- {+3} Supercycle
- {+2} Cycle
- {+1} Primary
- No subscript: Intermediate
- {-1} Minor
- {-2} Minute
- {-3} Minuette
- {-4} Subminuette
- {-5} Micro
- {-6} Submicro
- {-7} Minuscule
- {-8} Subminuscule
- {-9} Bitsy
- {-10} Subbitsy
By Tim Bovee, Portland, Oregon, April 8, 2021
Disclaimer
Tim Bovee, Private Trader tracks the analysis and trades of a private trader for his own accounts. Nothing in this blog constitutes a recommendation to buy or sell stocks, options or any other financial instrument. The only purpose of this blog is to provide education and entertainment.
No trader is ever 100 percent successful in his or her trades. Trading in the stock and option markets is risky and uncertain. Each trader must make trading decisions for his or her own account, and take responsibility for the consequences.
License
All content on Tim Bovee, Private Trader by Timothy K. Bovee is licensed under a Creative Commons Attribution-ShareAlike 4.0 International License.
Based on a work at www.timbovee.com.

You must be logged in to post a comment.