4:05 p.m. New York time
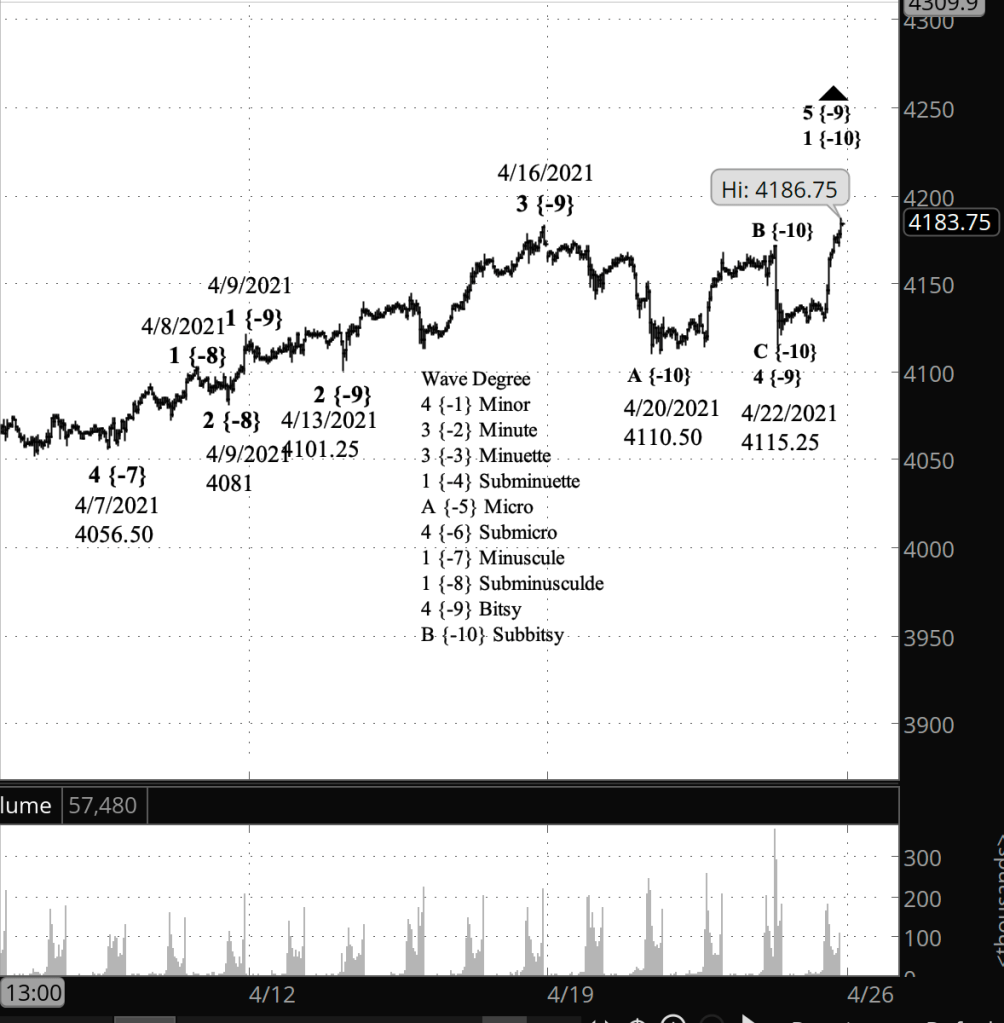
At the close.The high point of the day at the close was 4186.75 on the futures, 4194.17 on the index. In terms of Elliott wave analysis, the upward trend that began on April 22 is, from smaller to larger…
wave 1 of Subbitsy degree
within wave 5 of Bitsy degree
within wave 3 of Subminuscule degree
within wave 5 of Minuscule degree
within wave 3 of Submicro degree
within wave 3 of Micro degree
within wave 5 of Subminuette degree, which began its rise last December 21 from 3596 on the futures.
3:40 p.m. New York time
Twenty minutes before the closing bell. The S&P 500 has pushed up to a new high, resolving the count in favor of the bullish scenario.
9:50 a.m. New York time
What’s happening now? Overnight trading of the S&P 500 E-mini futures did little to clarify the chart, and so I’ve retained the two interpretations — bullish and bearish — as the choice between them remains too close to call.
What does it mean? The bullish scenario: One more push downward and then a reversal up to new highs. The bearish scenario: A push downward to below 4110.50 on the first leg, and then lower still after a correction.
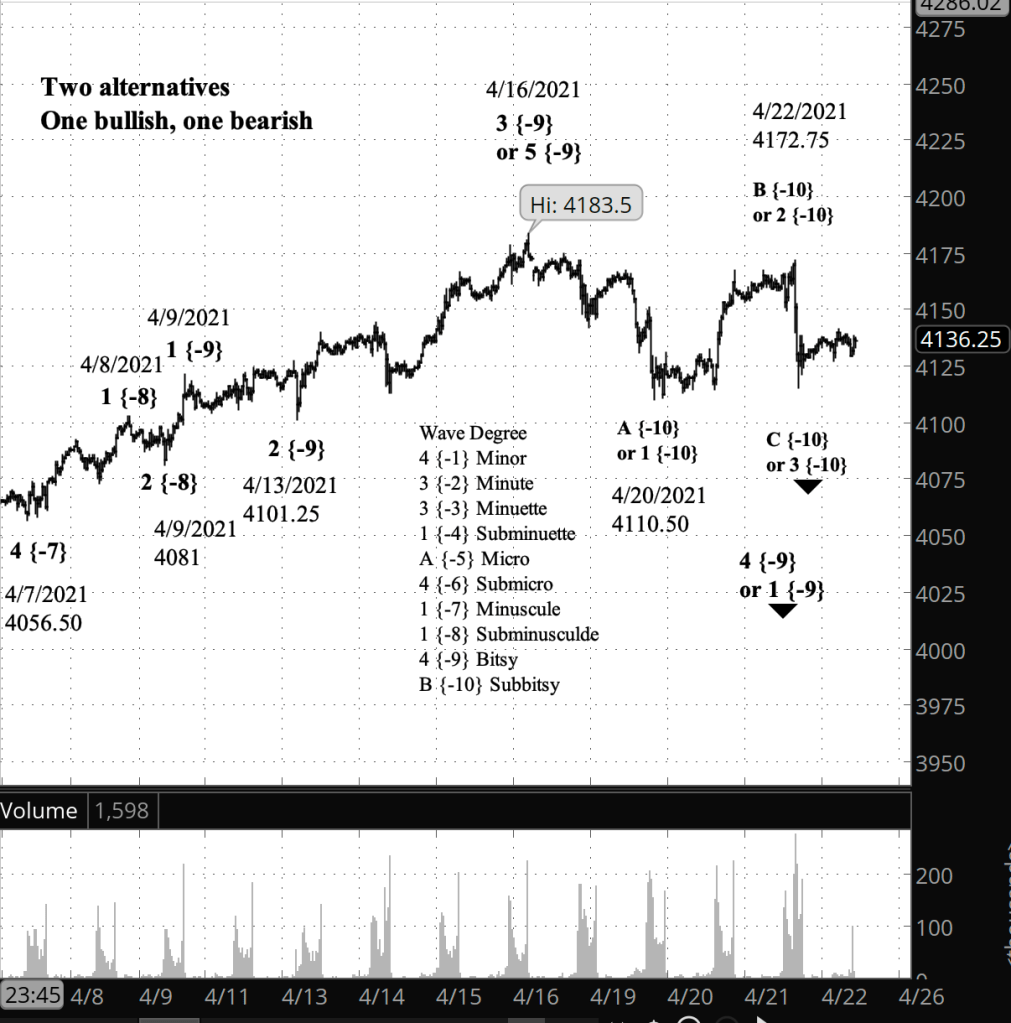
What does Elliott wave theory say? I took a longer glance at the rise from February 23, 2020 to a week ago, April 16, and it looks more like three waves up rather than five, which would lend a bit more credence to the bullish scenario. The count lacks the clarity to settle the choice. I’ll look at it in more detail this weekend.
Close up, the bullish scenario counts the decline from the 3rd wave peak on April 16 as wave 4 of Bitsy degree, which will be followed by wave 5 Bitsy degree, which will reach new highs. The bearish scenario counts the decline from the 5th wave peak on April 16 as wave 1 of Bitsy degree, which will move below its low so far of 4110.50.
Just a passing thought: Elliott wave analysis requires the analyst to bring more intuition to pattern recognition than any other analytical tool I’ve used. Elliott is the best tool I’ve found, but it lacks rigor. What it does bring to the table is an ability to quickly change its conclusions about the market, and to provide signals that will communicate that changed conclusion. As a trader, I find that to be incredibly useful.
Learning and other resources. Elliott Wave International has long been the leading analytical house based on Elliott wave theory. They make available a number of free educational materials and other resources, in addition to their for-pay subscriptions.
I recommend two books, both by people associated with EWI.
First, Elliott Wave Principle by Robert Prechter and A.J. Frost is the book that, along with Prechter’s analyses, that created the revival of Elliott wave theory. I first read it in 1984, and it has had a profound influenced on my thinking about markets ever since.
Second, I’ve found Visual Guide to Elliott Wave Trading by Wayne Gorman and Jeffrey Kennedy, both of EWI, to be a useful book that relates Elliott wave theory to practical trading. The authors are hands-on Elliotticians, and for an active trader, that’s exactly what’s needed — less theory and more how-to. The first chapter of the book gives a very nice thumbnail run down of what Elliott wave theory is all about.
Terminology. Here are some links to information about some of the technical jargon I use.
Charts. On my charts, waves have a subscript showing the degree above or below the Intermediate degree. Here are the subscripts and the degree each represents:
- {+3} Supercycle
- {+2} Cycle
- {+1} Primary
- No subscript: Intermediate
- {-1} Minor
- {-2} Minute
- {-3} Minuette
- {-4} Subminuette
- {-5} Micro
- {-6} Submicro
- {-7} Minuscule
- {-8} Subminuscule
- {-9} Bitsy
- {-10} Subbitsy
By Tim Bovee, Portland, Oregon, April 23, 2021
Disclaimer
Tim Bovee, Private Trader tracks the analysis and trades of a private trader for his own accounts. Nothing in this blog constitutes a recommendation to buy or sell stocks, options or any other financial instrument. The only purpose of this blog is to provide education and entertainment.
No trader is ever 100 percent successful in his or her trades. Trading in the stock and option markets is risky and uncertain. Each trader must make trading decisions for his or her own account, and take responsibility for the consequences.
License
All content on Tim Bovee, Private Trader by Timothy K. Bovee is licensed under a Creative Commons Attribution-ShareAlike 4.0 International License.
Based on a work at www.timbovee.com.

You must be logged in to post a comment.