10:35 a.m. New York time
What’s happening now? Bitcoin continues to trade below yesterday’s peak of 55,790 in what appears to be a correction within the the rise that began April 23.
What does it mean? The upward correction, if it is in fact complete, will be followed by a resumption of the downtrend that began on April 14 from 65,520.
What’s the alternative? Yesterday’s peak may in fact not be the end of the rise from April 23, although the rise has met the basic requirements of Elliott wave analysis.
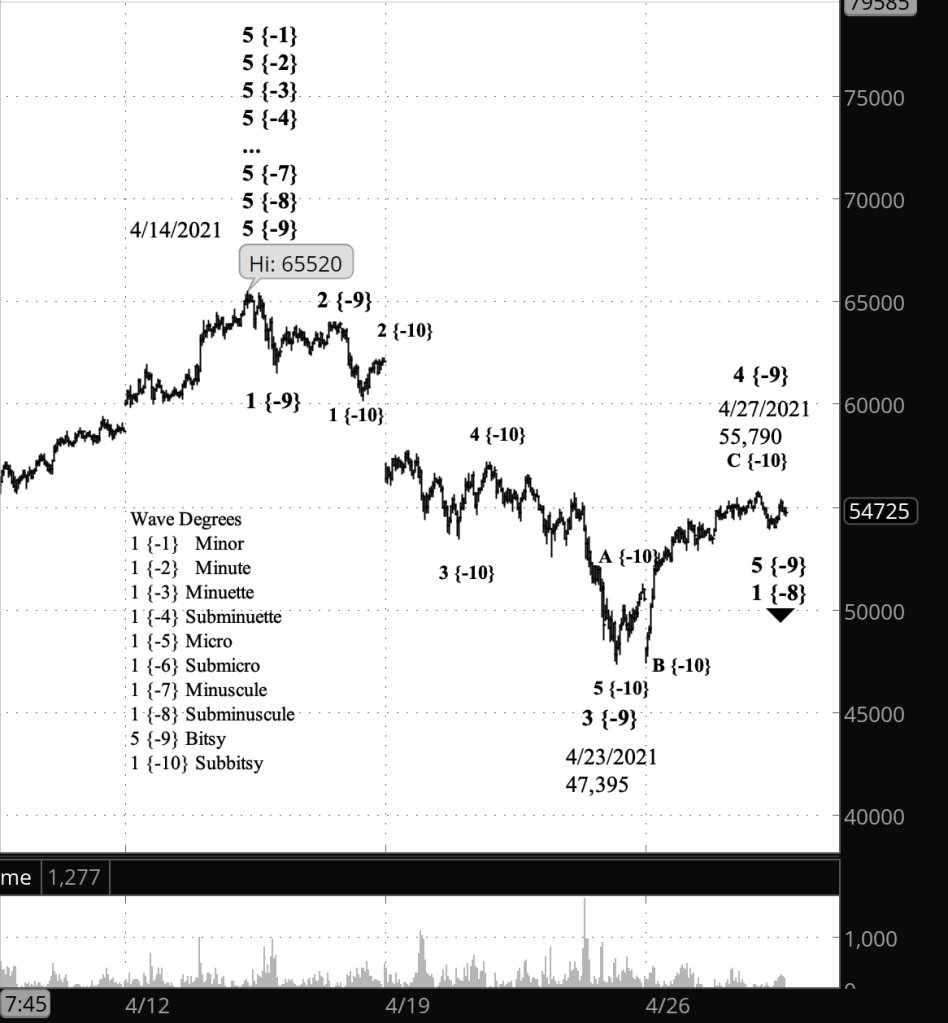
What does Elliott wave theory say? The April 14 peak appears to be the start of a major trend reversal, with the new downtrend in its early stages: Wave 1 of Subminuscule degree. Within that degree, the price has just completed or is about to complete wave C of Subbitsy degree within wave 4 of Bitsy degree. The upward 4th wave correction is being (or will be) followed by a Bitsy 5th wave movement downward.
Learning and other resources. Elliott Wave International has long been the leading analytical house based on Elliott wave theory. They make available a number of free educational materials and other resources, in addition to their for-pay subscriptions.
I recommend two books, both by people associated with EWI.
First, Elliott Wave Principle by Robert Prechter and A.J. Frost is the book that, along with Prechter’s analyses, that created the revival of Elliott wave theory. I first read it in 1984, and it has had a profound influenced on my thinking about markets ever since.
Second, I’ve found Visual Guide to Elliott Wave Trading by Wayne Gorman and Jeffrey Kennedy, both of EWI, to be a useful book that relates Elliott wave theory to practical trading. The authors are hands-on Elliotticians, and for an active trader, that’s exactly what’s needed — less theory and more how-to. The first chapter of the book gives a very nice thumbnail run down of what Elliott wave theory is all about.
Terminology. Here are some links to information about some of the technical jargon I use.
Charts. On my charts, waves have a subscript showing the degree above or below the Intermediate degree. Here are the subscripts and the degree each represents:
- {+3} Supercycle
- {+2} Cycle
- {+1} Primary
- No subscript: Intermediate
- {-1} Minor
- {-2} Minute
- {-3} Minuette
- {-4} Subminuette
- {-5} Micro
- {-6} Submicro
- {-7} Minuscule
- {-8} Subminuscule
- {-9} Bitsy
- {-10} Subbitsy
By Tim Bovee, Portland, Oregon, April 28, 2021
Disclaimer
Tim Bovee, Private Trader tracks the analysis and trades of a private trader for his own accounts. Nothing in this blog constitutes a recommendation to buy or sell stocks, options or any other financial instrument. The only purpose of this blog is to provide education and entertainment.
No trader is ever 100 percent successful in his or her trades. Trading in the stock and option markets is risky and uncertain. Each trader must make trading decisions for his or her own account, and take responsibility for the consequences.
License
All content on Tim Bovee, Private Trader by Timothy K. Bovee is licensed under a Creative Commons Attribution-ShareAlike 4.0 International License.
Based on a work at www.timbovee.com.

You must be logged in to post a comment.