3:30 p.m. New York time
Half an hour before the closing bell. The S&P 500 continued downward, falling below Thursday’s low of 4168, to 4167.50 so far today. No change in the analysis. Chart updated.
9:40 a.m. New York time
What’s happening now? The S&P 500 e-mini futures resumed their downward movement after a rise that remained below the April 29 peak of 4211.
What does it mean? The failure to reach a new high suggests that 4211 marks the end of the rise that began on April 22 from 4115.25 and the beginning of a downward correction of the rise that began on April 9 from 4081.
What’s the alternative? The decline has yet to move below yesterday’s low of 4168, so it’s possible that the decline is a step within the rise that began on April 22. A move below 4168 will reduce the likelihood of this alternative analysis.
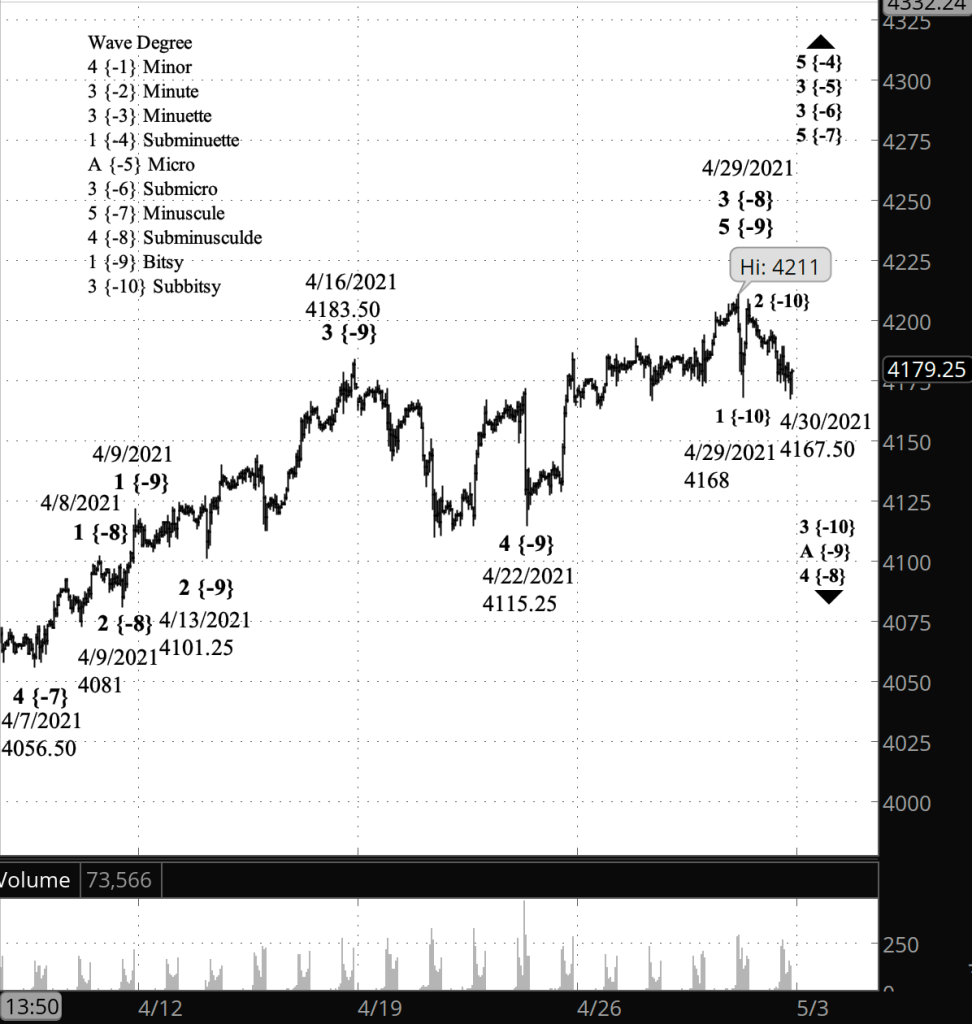
What does Elliott wave theory say? I’ve marked the chart according to the primary analysis, treating the high of April 29 as the end of wave 5 of Bitsy degree and also of the parent wave 3 of Subminuscule degree. The subsequent Subminuscule 4 correction is underway. Within Subminuscule 4, the decline in overnight trading was wave 1 of Subbitsy degree within wave A of Bitsy degree. If the Subminuscule 4 correction is taking the form of a Flat, then Bitsy wave A will have three waves internally at the Subbitsy level. If it is a Zigzag pattern, then Bitsy A will have five internal waves.
Learning and other resources. Elliott Wave International has long been the leading analytical house based on Elliott wave theory. They make available a number of free educational materials and other resources, in addition to their for-pay subscriptions.
I recommend two books, both by people associated with EWI.
First, Elliott Wave Principle by Robert Prechter and A.J. Frost is the book that, along with Prechter’s analyses, that created the revival of Elliott wave theory. I first read it in 1984, and it has had a profound influenced on my thinking about markets ever since.
Second, I’ve found Visual Guide to Elliott Wave Trading by Wayne Gorman and Jeffrey Kennedy, both of EWI, to be a useful book that relates Elliott wave theory to practical trading. The authors are hands-on Elliotticians, and for an active trader, that’s exactly what’s needed — less theory and more how-to. The first chapter of the book gives a very nice thumbnail run down of what Elliott wave theory is all about.
Terminology. Here are some links to information about some of the technical jargon I use.
Charts. On my charts, waves have a subscript showing the degree above or below the Intermediate degree. Here are the subscripts and the degree each represents:
- {+3} Supercycle
- {+2} Cycle
- {+1} Primary
- No subscript: Intermediate
- {-1} Minor
- {-2} Minute
- {-3} Minuette
- {-4} Subminuette
- {-5} Micro
- {-6} Submicro
- {-7} Minuscule
- {-8} Subminuscule
- {-9} Bitsy
- {-10} Subbitsy
By Tim Bovee, Portland, Oregon, April 30, 2021
Disclaimer
Tim Bovee, Private Trader tracks the analysis and trades of a private trader for his own accounts. Nothing in this blog constitutes a recommendation to buy or sell stocks, options or any other financial instrument. The only purpose of this blog is to provide education and entertainment.
No trader is ever 100 percent successful in his or her trades. Trading in the stock and option markets is risky and uncertain. Each trader must make trading decisions for his or her own account, and take responsibility for the consequences.
License
All content on Tim Bovee, Private Trader by Timothy K. Bovee is licensed under a Creative Commons Attribution-ShareAlike 4.0 International License.
Based on a work at www.timbovee.com.

You must be logged in to post a comment.