3:30 p.m. New York time
Half an hour before the closing bell. The S&P 500 E-mini futures rose to within 50 cents of the May 4 high and then resumed its downward trajectory, leaving my principle analysis intact. I’ve updated the chart.
12:50 p.m. New York time
My trades. I’ve entered a bear call options spread on XBI. The entry analysis may be found here.
9:45 a.m. New York time
What’s happening now? The S&P 500 E-mini futures traded in a narrow range overnight as the price moved through the late stage of the beginning leg of a downward correction.
What does it mean? The correction, which began on April 29 from 4211, has so far reached a low of 4120, on May 4. The tentative decline that began yesterday a 4180 will carry the price below the April 29 low to complete the first leg of a larger correction to the downside.
What’s the alternative? It’s possible that the first leg of the larger correction has not yet reached its final decline. Instead, the upward countertrend within the larger downtrend may still be underway.
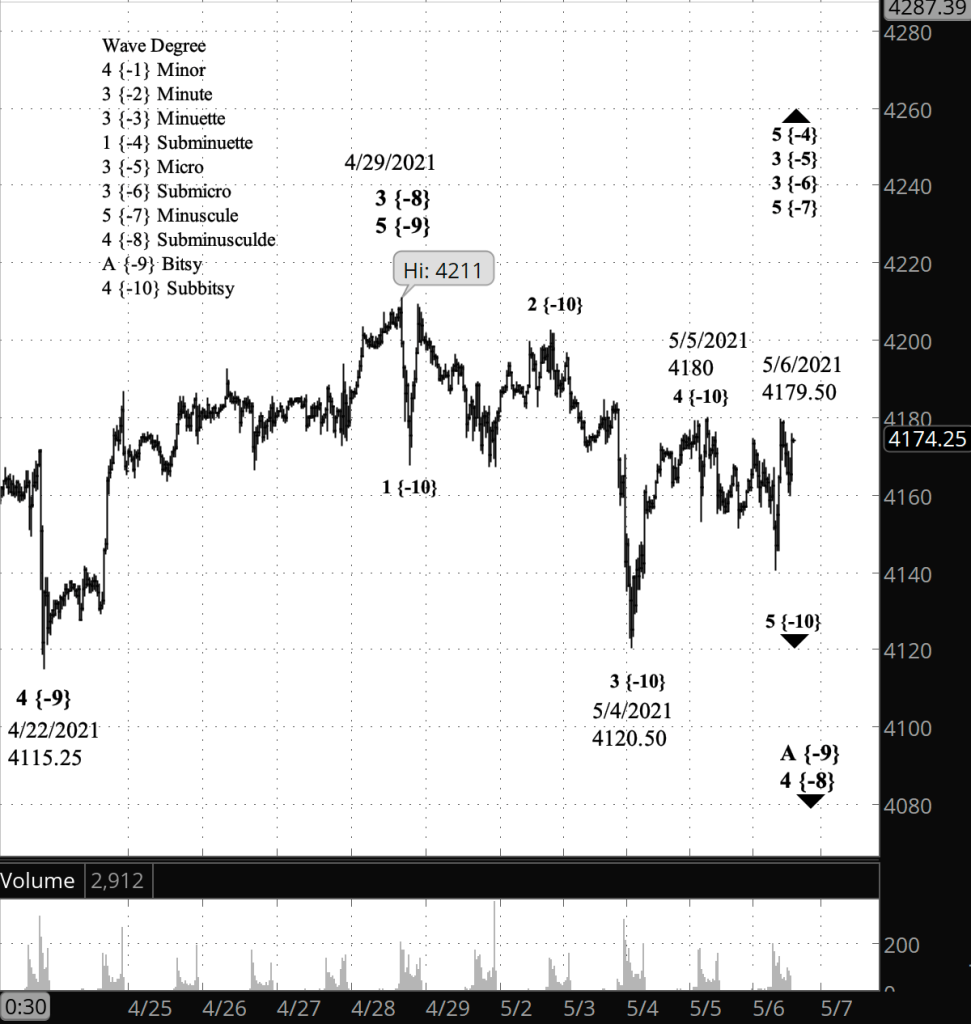
What does Elliott wave theory say? The larger downtrend is wave A of Bitsy degree within wave 4 of Subminuscule degree, the latter having begun on April 29. Within wave A, wave 5 of Subbitsy degree will carry the price below 4120.50, which was the end of wave 3 of Subbitsy degree. Once Subbitsy 5 is complete, the next step will be an upward movement, wave B of Bitsy degree, the middle wave of the Subminuscule wave 4 correction.
The alternative count has Subbitsy wave 4 underway, with Subbitsy 5 still in the future. A decisive move to the downside would confirm that Subbitsy 5 has begun.
Learning and other resources. Elliott Wave International has long been the leading analytical house based on Elliott wave theory. They make available a number of free educational materials and other resources, in addition to their for-pay subscriptions.
I recommend two books, both by people associated with EWI.
First, Elliott Wave Principle by Robert Prechter and A.J. Frost is the book that, along with Prechter’s analyses, that created the revival of Elliott wave theory. I first read it in 1984, and it has had a profound influenced on my thinking about markets ever since.
Second, I’ve found Visual Guide to Elliott Wave Trading by Wayne Gorman and Jeffrey Kennedy, both of EWI, to be a useful book that relates Elliott wave theory to practical trading. The authors are hands-on Elliotticians, and for an active trader, that’s exactly what’s needed — less theory and more how-to. The first chapter of the book gives a very nice thumbnail run down of what Elliott wave theory is all about.
Terminology. Here are some links to information about some of the technical jargon I use.
Charts. On my charts, waves have a subscript showing the degree above or below the Intermediate degree. Here are the subscripts and the degree each represents:
- {+3} Supercycle
- {+2} Cycle
- {+1} Primary
- No subscript: Intermediate
- {-1} Minor
- {-2} Minute
- {-3} Minuette
- {-4} Subminuette
- {-5} Micro
- {-6} Submicro
- {-7} Minuscule
- {-8} Subminuscule
- {-9} Bitsy
- {-10} Subbitsy
By Tim Bovee, Portland, Oregon, May 6, 2021
Disclaimer
Tim Bovee, Private Trader tracks the analysis and trades of a private trader for his own accounts. Nothing in this blog constitutes a recommendation to buy or sell stocks, options or any other financial instrument. The only purpose of this blog is to provide education and entertainment.
No trader is ever 100 percent successful in his or her trades. Trading in the stock and option markets is risky and uncertain. Each trader must make trading decisions for his or her own account, and take responsibility for the consequences.
License
All content on Tim Bovee, Private Trader by Timothy K. Bovee is licensed under a Creative Commons Attribution-ShareAlike 4.0 International License.
Based on a work at www.timbovee.com.

You must be logged in to post a comment.