3:30 p.m. New York time
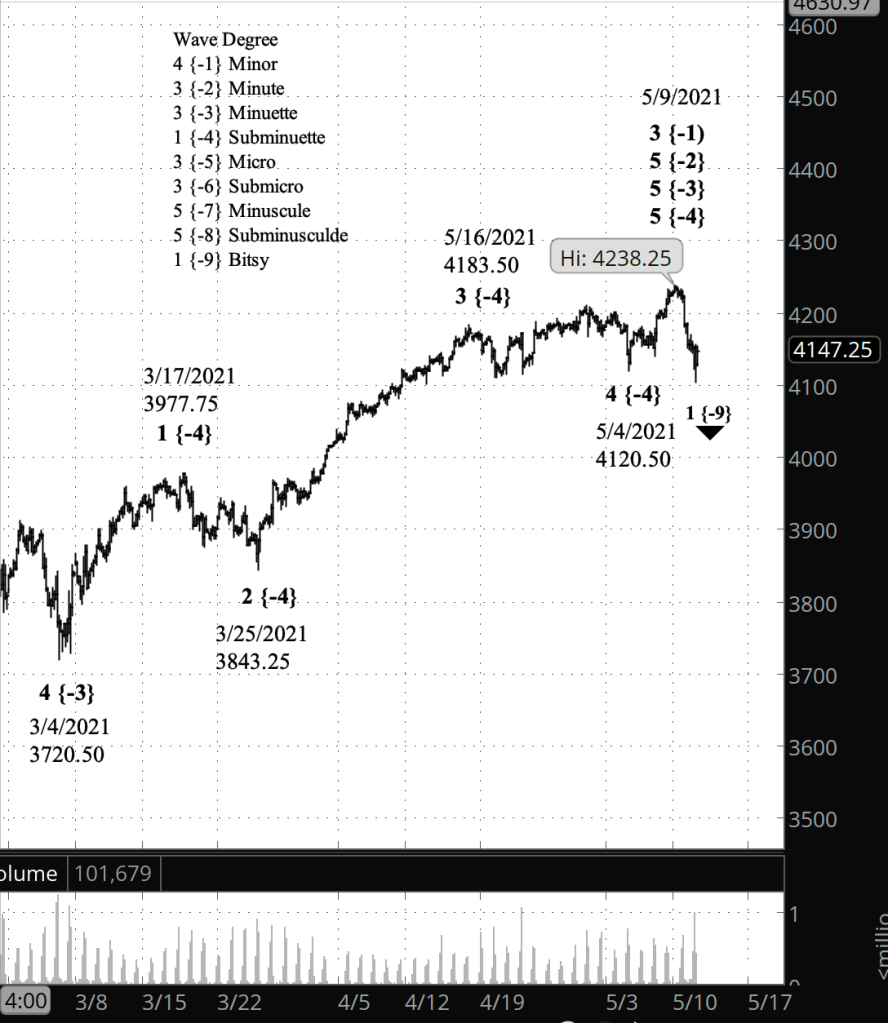
Half an hour before the closing bell. The S&P 500 spent much of the day trading in a narrow range, in the low to mid 4100s. I’ve updated the near-term chart. The analysis remains unchanged.
10:25 a.m. New York time
What’s happening now? The S&P 500 E-mini futures fell sharply overnight, creating an opening gap on the S&P 500 index.
What does it mean? The power of the decline was sufficient to cast doubt on my analysis treating the May 9 of 4238.25 peak as part of an ongoing rise. The peak appears to have completed the uptrend that began on March 4 from 3720.50. A new downtrend has begun.
What’s the alternative? A sharp reversal to the upside and a new high would require another major re-analysis based on the premise that the rise from March 4 is still underway.
What does Elliott wave theory say? The rule that forced the recount is this: Wave 4 can’t move beyond the start of wave 1. If the analysis shows that happening, then it’s not a 4th wave.
In my recount, I see March 4 as marking the end of wave 4 of Minuette degree and the beginning of the 5th and final wave up of Minuette degree. It is that 5th wave that ended on May 9.
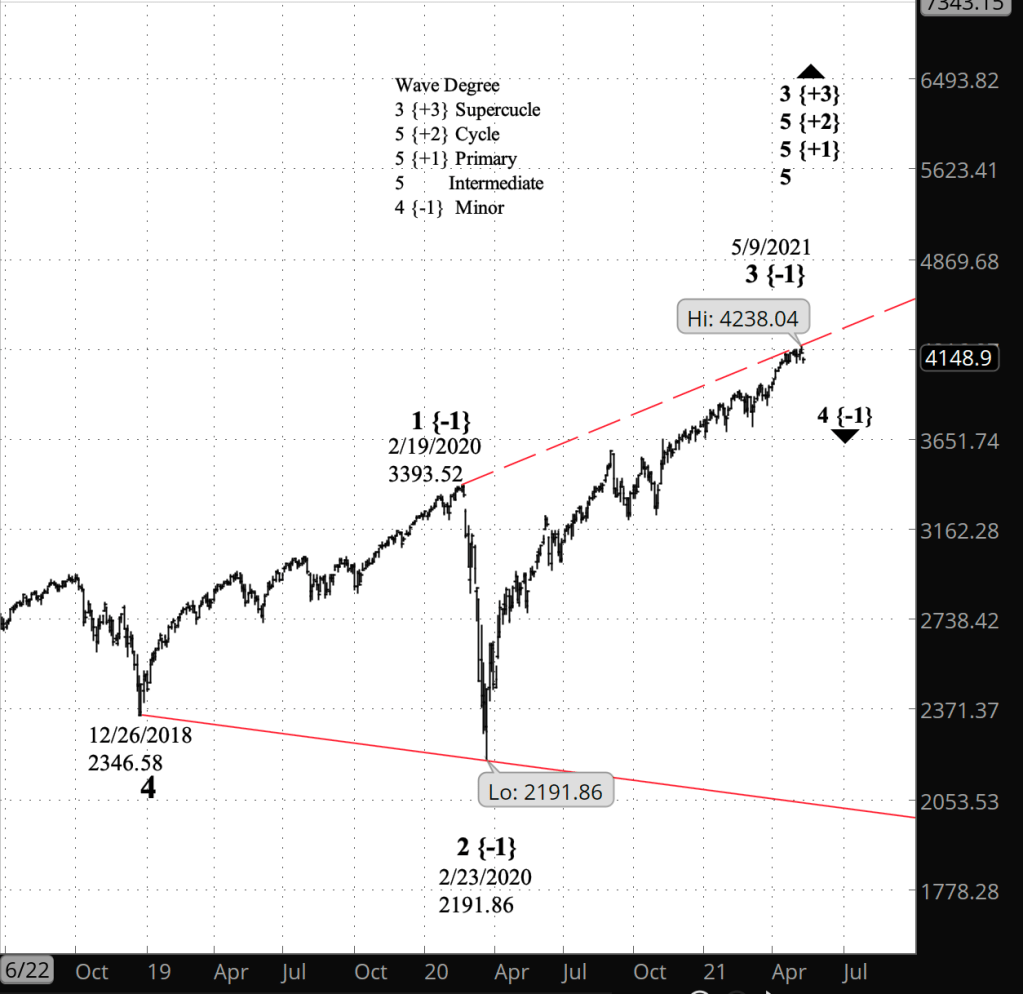
The May 9 peak also marks the end of a series of larger waves: Wave 5 of Minute degree within wave 3 of Minor degree. Minor degree 3 began on February 23, 2020 from 2191.86, the end of the crash early in the pandemic.
What follows will be a 4th wave correction at the Minor degree that will play out over the next few months. I’ve marked the initial decline from the May 9 peak as wave 1 of Bitsy degree, although at this point that’s a guess. It is the first movement down of wave A of Minute degree within wave 4 of Minor degree.
Here’s a big-picture chart looking back to 2018.
Learning and other resources. Elliott Wave International has long been the leading analytical house based on Elliott wave theory. They make available a number of free educational materials and other resources, in addition to their for-pay subscriptions.
I recommend two books, both by people associated with EWI.
First, Elliott Wave Principle by Robert Prechter and A.J. Frost is the book that, along with Prechter’s analyses, that created the revival of Elliott wave theory. I first read it in 1984, and it has had a profound influenced on my thinking about markets ever since.
Second, I’ve found Visual Guide to Elliott Wave Trading by Wayne Gorman and Jeffrey Kennedy, both of EWI, to be a useful book that relates Elliott wave theory to practical trading. The authors are hands-on Elliotticians, and for an active trader, that’s exactly what’s needed — less theory and more how-to. The first chapter of the book gives a very nice thumbnail run down of what Elliott wave theory is all about.
Terminology. Here are some links to information about some of the technical jargon I use.
Charts. On my charts, waves have a subscript showing the degree above or below the Intermediate degree. Here are the subscripts and the degree each represents:
- {+3} Supercycle
- {+2} Cycle
- {+1} Primary
- No subscript: Intermediate
- {-1} Minor
- {-2} Minute
- {-3} Minuette
- {-4} Subminuette
- {-5} Micro
- {-6} Submicro
- {-7} Minuscule
- {-8} Subminuscule
- {-9} Bitsy
- {-10} Subbitsy
By Tim Bovee, Portland, Oregon, May 11, 2021
Disclaimer
Tim Bovee, Private Trader tracks the analysis and trades of a private trader for his own accounts. Nothing in this blog constitutes a recommendation to buy or sell stocks, options or any other financial instrument. The only purpose of this blog is to provide education and entertainment.
No trader is ever 100 percent successful in his or her trades. Trading in the stock and option markets is risky and uncertain. Each trader must make trading decisions for his or her own account, and take responsibility for the consequences.
License
All content on Tim Bovee, Private Trader by Timothy K. Bovee is licensed under a Creative Commons Attribution-ShareAlike 4.0 International License.
Based on a work at www.timbovee.com.

Sadly, Elliott wave analysis isn’t a crystal ball. Rather, it’s a way of thinking about the chart and its context as it stands at any given moment. There’s always an alternative, the possibility that the market will move in ways that will invalidate the count. That’s what happened overnight, and I’m sure it will happen again. It’s the nature of the markets. I never place a trade without considering two metrics: What are the odds of success? And what’s the risk/reward estimate. For stocks, I always consider the odds of success to be no better than 50:50. Options are more nuanced, and I can construct trades that will have higher odds of success. which sometimes go wrong. Calculating a risk/reward estimate forces me to think about the worst possible outcome, and to size my trades accordingly. I wish you the best.
LikeLike