3:30 p.m. New York time
Half an hour before the closing bell. The S&P 500 hit a low of 4029.25 on the futures, 4056.88 on the index, and turned up in what I count as a very low degree 2nd wave correction to the upside, perhaps at Subbitsy degree, within a 1st wave downtrend one degree higher, perhaps at Bitsy degree. I’ve updated the chart below. No change in the analysis.
2 p.m. New York time
My trades. I’ve exited my bear call options spread on XBI for 50% of maximum potential profit. The updated analysis can be seen here.
9:40 a.m.New York time
What’s happening now? The S&P 500 E-mini futures continued a halting decline, reaching a low overnight of 4029.25.
What does it mean? The decline that began on May 9 from 4238.25 on the futures, 4238.04 on the index, remains in its early stages. Like all market movements, it is a combination of rises and falls of ever-smaller degrees. By my principle analysis, the main line of movement within all of those fluctuations will be net down.
What’s the alternative? If the price reverses and moves above the May 9 high, then the rise that began March 4 from 3720.50 is still underway. By my alternate analysis, the main line of movement within the fluctuations would be net up.
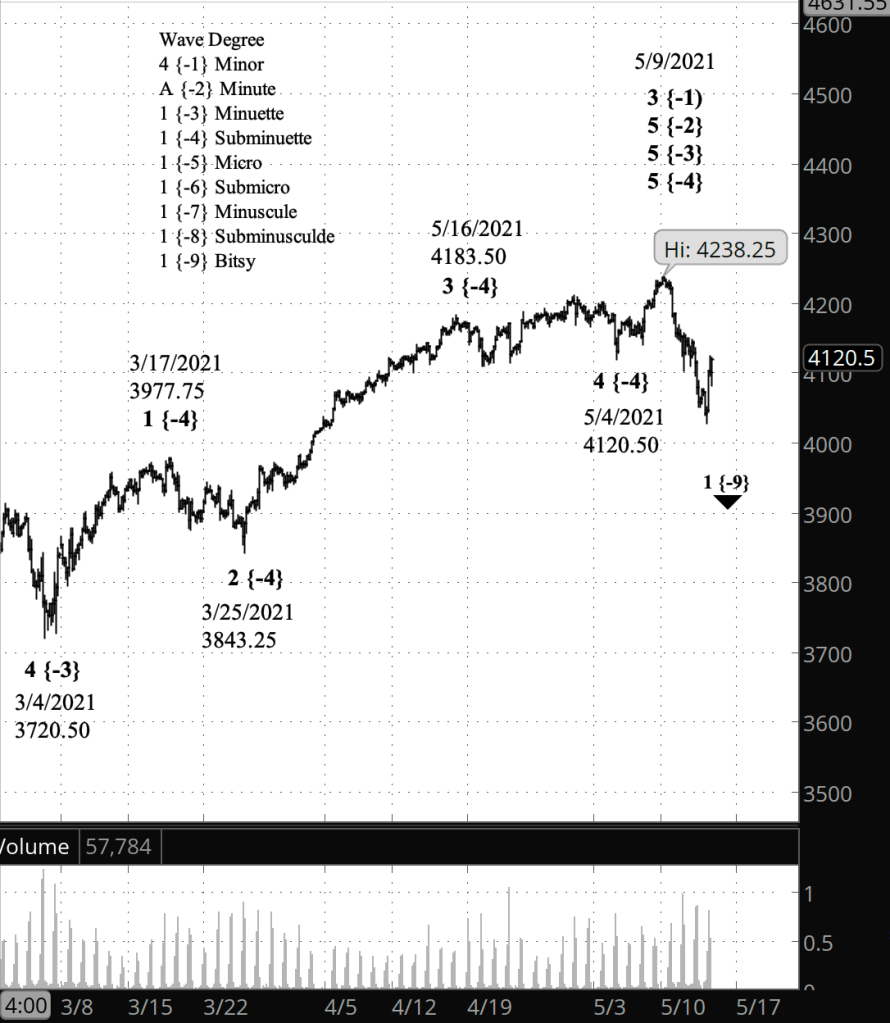
What does Elliott wave theory say? The peak of May 9 marked the end of upward-trendingwave 5 of Minuette degree, which began on March 4. The decline that followed is a small degree wave 1, perhaps of Bitsy degree, in a new downtrend all the way up to Minuette degree. That downtrend is the initial stage of wave A of Minute degree within wave 4 of Minor degree, which will take months to play out.
Learning and other resources. Elliott Wave International has long been the leading analytical house based on Elliott wave theory. They make available a number of free educational materials and other resources, in addition to their for-pay subscriptions.
I recommend two books, both by people associated with EWI.
First, Elliott Wave Principle by Robert Prechter and A.J. Frost is the book that, along with Prechter’s analyses, that created the revival of Elliott wave theory. I first read it in 1984, and it has had a profound influenced on my thinking about markets ever since.
Second, I’ve found Visual Guide to Elliott Wave Trading by Wayne Gorman and Jeffrey Kennedy, both of EWI, to be a useful book that relates Elliott wave theory to practical trading. The authors are hands-on Elliotticians, and for an active trader, that’s exactly what’s needed — less theory and more how-to. The first chapter of the book gives a very nice thumbnail run down of what Elliott wave theory is all about.
Terminology. Here are some links to information about some of the technical jargon I use.
Charts. On my charts, waves have a subscript showing the degree above or below the Intermediate degree. Here are the subscripts and the degree each represents:
- {+3} Supercycle
- {+2} Cycle
- {+1} Primary
- No subscript: Intermediate
- {-1} Minor
- {-2} Minute
- {-3} Minuette
- {-4} Subminuette
- {-5} Micro
- {-6} Submicro
- {-7} Minuscule
- {-8} Subminuscule
- {-9} Bitsy
- {-10} Subbitsy
By Tim Bovee, Portland, Oregon, May 13, 2021
Disclaimer
Tim Bovee, Private Trader tracks the analysis and trades of a private trader for his own accounts. Nothing in this blog constitutes a recommendation to buy or sell stocks, options or any other financial instrument. The only purpose of this blog is to provide education and entertainment.
No trader is ever 100 percent successful in his or her trades. Trading in the stock and option markets is risky and uncertain. Each trader must make trading decisions for his or her own account, and take responsibility for the consequences.
License
All content on Tim Bovee, Private Trader by Timothy K. Bovee is licensed under a Creative Commons Attribution-ShareAlike 4.0 International License.
Based on a work at www.timbovee.com.

You must be logged in to post a comment.