3:30 p.m. New York time
Half an hour before the closing bell. Perhaps it is in anticipation of Monday’s Memorial Day holiday in the United States, but the S&P 500 has done very little today, trading within a narrow range that is the stock-chart definition of boring. I’ve updated the chart below.
The U.S. markets are closed on Monday, but futures will trade on a truncated schedule. I’ll post an analysis of the S&P 500 E-mini futures Monday morning, and shall skip the afternoon update unless there’s a significant move.
9:40 a.m. New York time
What’s happening now? The S&P 500 E-mini futures rose higher in overnight trading, to 4217.40, and then stayed within a very narrow range.
What does it mean? The upward correction that began on May 13 from 4029.25 is still underway.
What’s the alternative? Unchanged from yesterday: If the price moves above 4238.25, the high of May 9, then the uptrend that began last year is still underway and higher prices lie ahead. If the price reverses and drops below 4029.25, the low of May 13, then the energetic middle portion of the downtrend that began May 9 is underway.
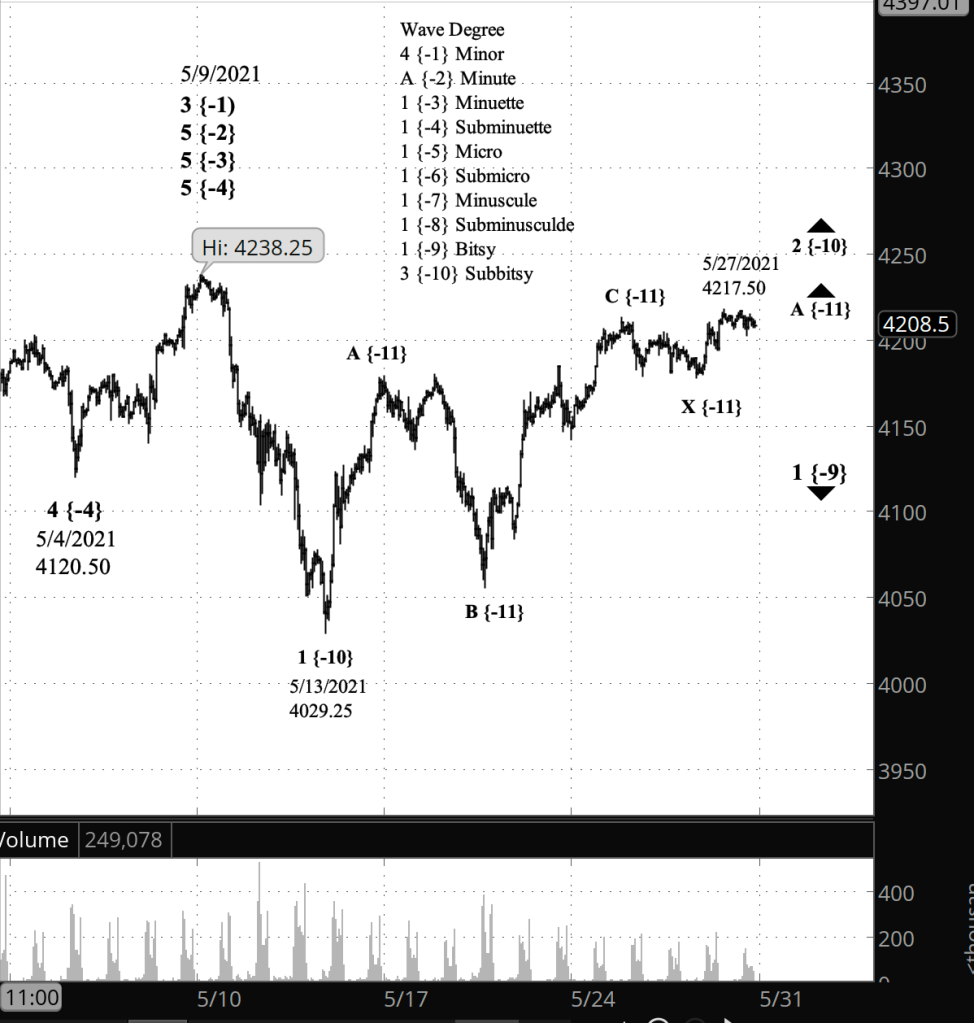
What does Elliott wave theory say? Under my principle analysis, the price is presently in wave A of the second portion of a compound correct, wave 2 of Subbitsy degree within downtrending wave 1 of Bitsy degree.
Learning and other resources. Elliott Wave International has long been the leading analytical house based on Elliott wave theory. They make available a number of free educational materials and other resources, in addition to their for-pay subscriptions.
I recommend two books, both by people associated with EWI.
First, Elliott Wave Principle by Robert Prechter and A.J. Frost is the book that, along with Prechter’s analyses, that created the revival of Elliott wave theory. I first read it in 1984, and it has had a profound influenced on my thinking about markets ever since.
Second, I’ve found Visual Guide to Elliott Wave Trading by Wayne Gorman and Jeffrey Kennedy, both of EWI, to be a useful book that relates Elliott wave theory to practical trading. The authors are hands-on Elliotticians, and for an active trader, that’s exactly what’s needed — less theory and more how-to. The first chapter of the book gives a very nice thumbnail run down of what Elliott wave theory is all about.
Terminology. Here are some links to information about some of the technical jargon I use.
Charts. On my charts, waves have a subscript showing the degree above or below the Intermediate degree. Here are the subscripts and the degree each represents:
- {+3} Supercycle
- {+2} Cycle
- {+1} Primary
- No subscript: Intermediate
- {-1} Minor
- {-2} Minute
- {-3} Minuette
- {-4} Subminuette
- {-5} Micro
- {-6} Submicro
- {-7} Minuscule
- {-8} Subminuscule
- {-9} Bitsy
- {-10} Subbitsy
By Tim Bovee, Portland, Oregon, May 28, 2021
Disclaimer
Tim Bovee, Private Trader tracks the analysis and trades of a private trader for his own accounts. Nothing in this blog constitutes a recommendation to buy or sell stocks, options or any other financial instrument. The only purpose of this blog is to provide education and entertainment.
No trader is ever 100 percent successful in his or her trades. Trading in the stock and option markets is risky and uncertain. Each trader must make trading decisions for his or her own account, and take responsibility for the consequences.
License
All content on Tim Bovee, Private Trader by Timothy K. Bovee is licensed under a Creative Commons Attribution-ShareAlike 4.0 International License.
Based on a work at www.timbovee.com.

You must be logged in to post a comment.