3:30 p.m. New York time
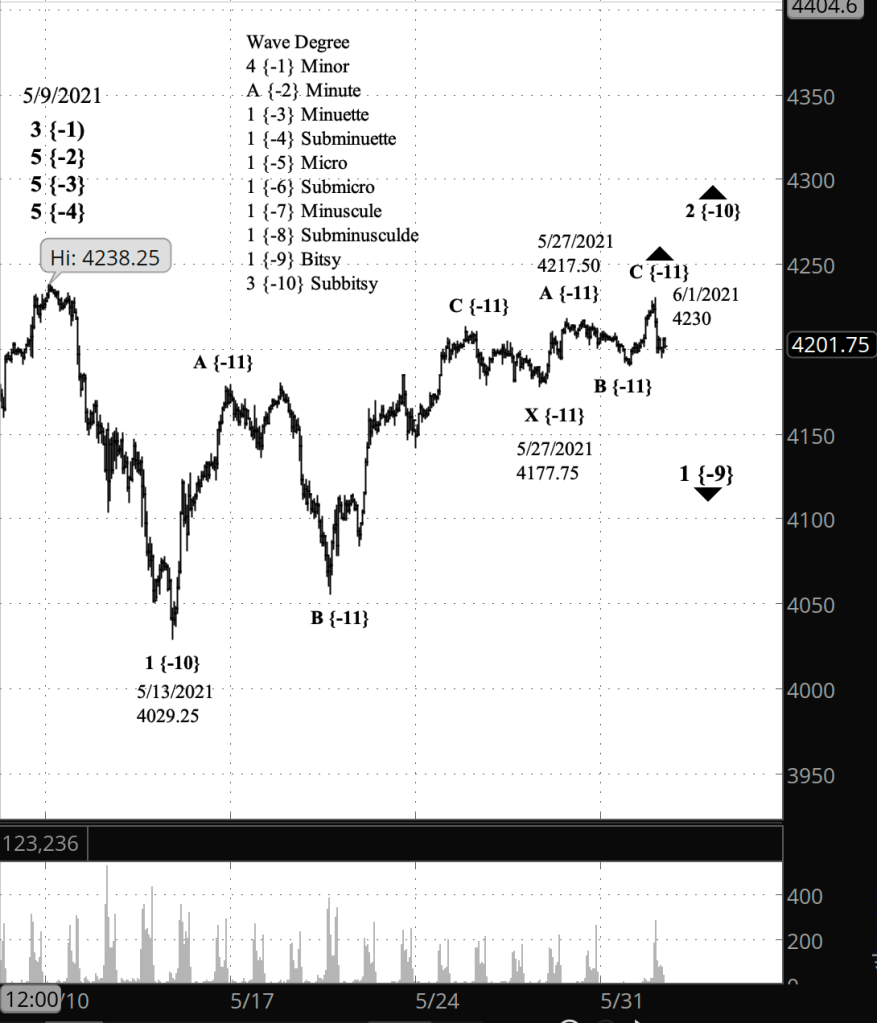
Half an hour before the closing bell. Having peaked in early trading, at 4230 on the futures and 4234.12 on the index, the S&P 500 fell through most of the day, reaching below 4200.
The decline so far is sufficient to create ambiguity in the Elliott wave analysis. As I’ve marked the chart, the decline is a corrective wave within uptrending wave C within uptrending wave 2 of Subbitsy degree. It would be just as reasonable to label this morning’s peak as the end of Subbitsy wave 2 and the start of Subbitsy 3 to the downside.
The morning peak is very close to the May 9 high of 4238.25, and as noted in this morning’s discussion, any move above that level changes the analysis of everything that has occurred since May 9. The count prior to the May 9 high suggests that level was the end of the uptrend, and if that is correct, there is very little room for a further rise.
9:40 a.m. New York time
What’s happening now? The S&P 500 E-mini futures rose sharply in overnight trading, reaching a high of 4230 shortly after the opening bell.
What does it mean? The rise is the final leg of a corrective pattern that began on May 27 from 4177.75. Once the pattern is complete, the price will begin a significant decline, in its initial phases reaching below the May 13 low of 4029.25.
What’s the alternative? The price is only a few points below the May 9 peak of 4238.25, which my principle analysis has as the starting point of a downtrend of high degree. If the price moves above that level, then the decline has been a correction in an ongoing uptrend.
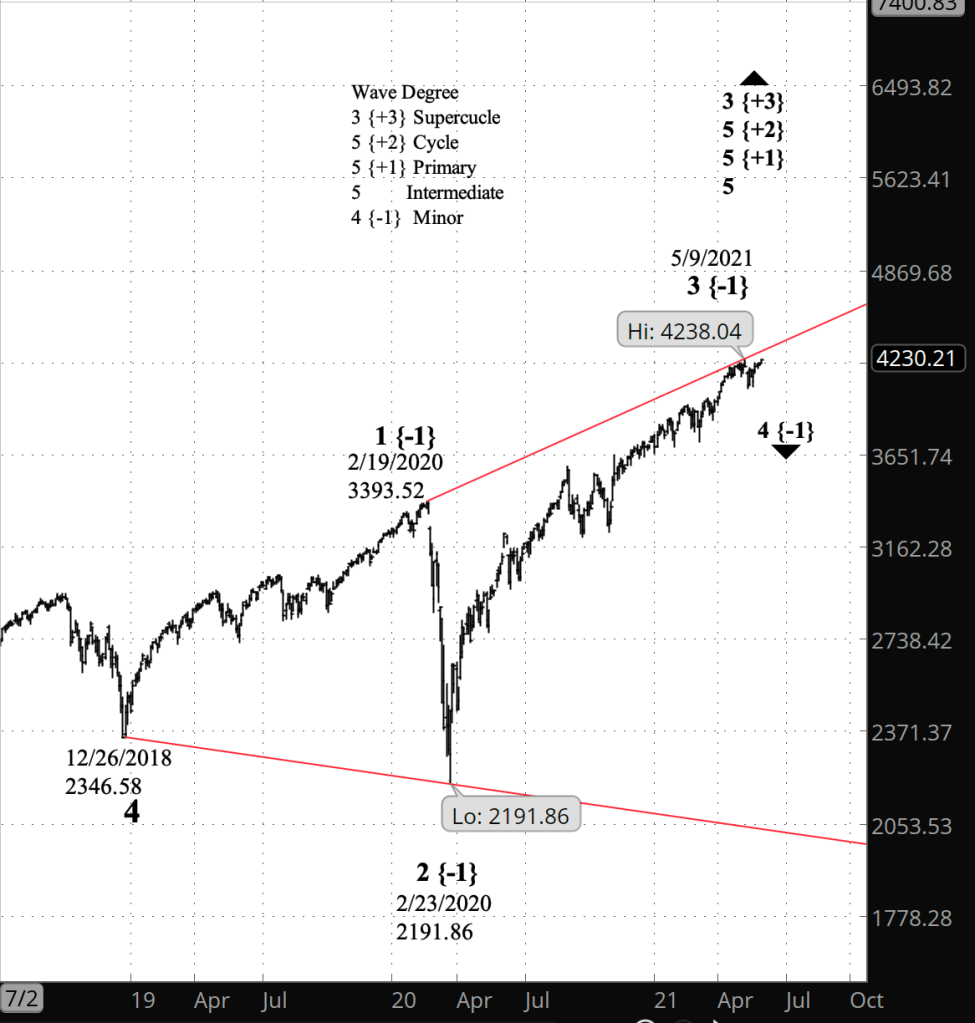
What does Elliott wave theory say? The May 9 peak of 4238.04 on the S&P 500 index ended a wave 3 rise of Minor degree that began on February 23, 2020 from 2191.86, the low point of the early pandemic crash. In my principle analysis I’ve labeled the ensuing decline as wave 1 of Bitsy degree, the first tiny step in a decline that will eventually move into the 2000s or lower, a 4th wave in an expanding Diagonal Triangle that began on December 26, 2018. The “expanding” part means that the price channel boundaries of the structure move further apart from each other, day by day.
Within Bitsy wave 1, Subbitsy wave 1 completed its fall on May 13, and Subbitsy wave 2 is underway. This 2nd wave has taken a compound form, in which two corrective patterns are connected by an X wave. The present corrective pattern, a Flat, began on May 27.
There is an unusual aspect of this correction within the downtrend. Second waves normally are simple Zigzag patterns; most of the compound corrections I’ve seen are in the 4th wave. Looking forward, the present wave C within Subbitsy wave 2 isn’t necessarily the end of the compound structure. I’ve occasionally — rarely — seen compounds go to a third corrective pattern.
But assuming two patterns within the compound correction, then the next move will be wave 3 of Bitsy degree, which will decline with the energy typical of 3rd waves, presenting the market with an OMG! moment.
The alternative analysis would kick in if the price rises above the May 9 peak, of 4238.25 on the futures. A rise above that price would mean that the subsequent decline was a 4th wave correction within the ongoing Minor wave 3 uptrend that began in February 2020. Such an outcome would force a redrawing of the upper price channel boundary and create an expectation of significant upside potential.
Learning and other resources. See the menu page Analytical Methods for a rundown on where to go for information on Elliott wave analysis.
By Tim Bovee, Portland, Oregon, June 1, 2021
Disclaimer
Tim Bovee, Private Trader tracks the analysis and trades of a private trader for his own accounts. Nothing in this blog constitutes a recommendation to buy or sell stocks, options or any other financial instrument. The only purpose of this blog is to provide education and entertainment.
No trader is ever 100 percent successful in his or her trades. Trading in the stock and option markets is risky and uncertain. Each trader must make trading decisions for his or her own account, and take responsibility for the consequences.
License
All content on Tim Bovee, Private Trader by Timothy K. Bovee is licensed under a Creative Commons Attribution-ShareAlike 4.0 International License.
Based on a work at www.timbovee.com.

You must be logged in to post a comment.