3:30 p.m. New York time
Half an hour before the closing bell. The S&P 500 rose from its overnight low, remaining above the start of wave 1 of Minuscule degree and below yesterday’s high. That positioning keeps alive the two equally likely alternatives discussed in this morning’s post. I’ve updated the chart, in the process correcting a labelling error. The wave number immediately above the price label for yesterday’s high, 4353.25, should read 3 {-7} rather than 4 {-7}.
9:55 a.m. New York time
What’s happening now? The S&P 500 E-mini futures dropped sharply in overnight trading from yesterday’s high of 4353.25, reaching a low so far of 4279.25.
What does it mean? If the price moves below 4269.25 — another 10 points lower — then the rise that began June 20 is complete, and the decline is the first step in what will become a major downtrend.
What’s the alternative? If the price remains above 4269.25 and reverses to rise above 4353.25, then the rise that began June 20 is still underway, and the price can be expected to reach still higher levels.
I consider both alternatives to be a equal likelihood. I can’t choose between them.
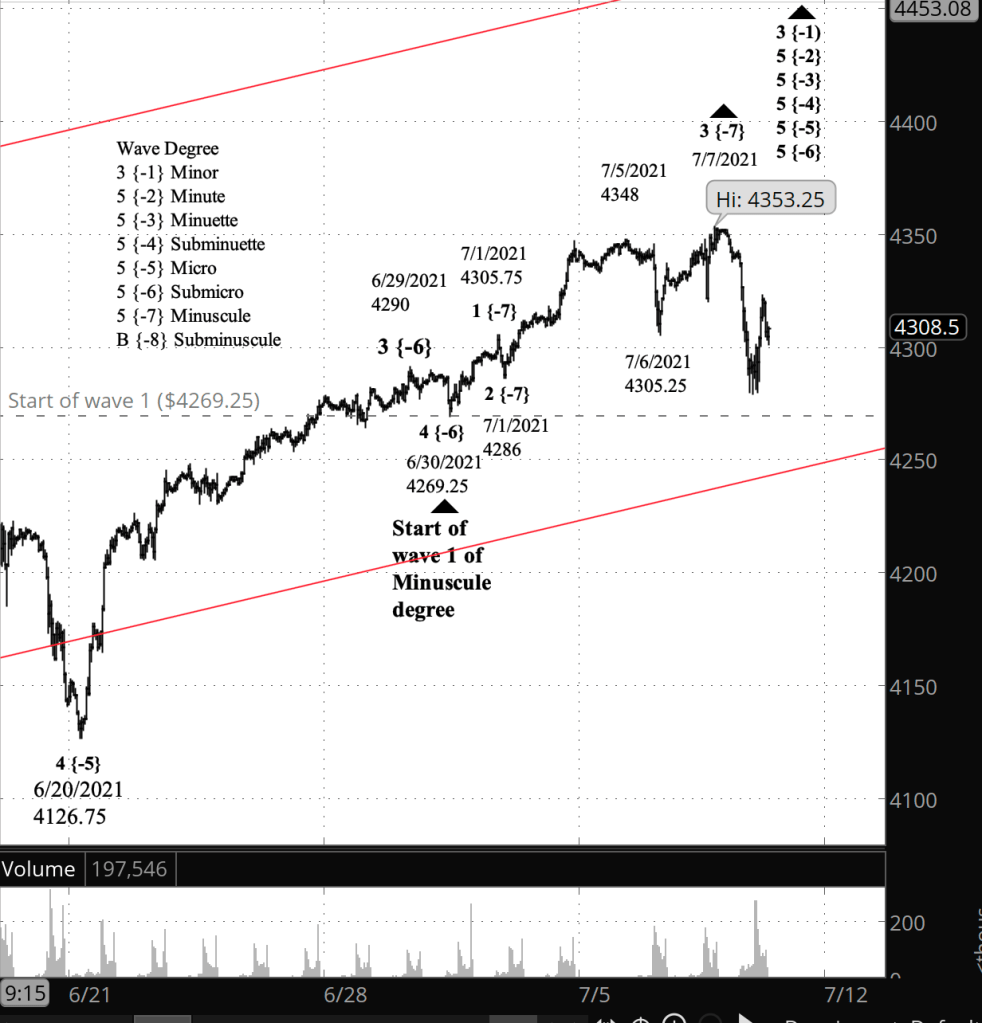
What does Elliott wave theory say? A rule of Elliott wave analysis says that a 4th wave cannot move beyond the start of the preceding 1st wave. That rule is the key to understanding the chart at this point.
Wave 1 of Minuscule degree began on June 30 from 4269.25. If Minuscule wave 3 is still underway (the count shown on the chart), then the overnight decline must be a 4th wave following the end of Minuscule 3. If the decline moves below 4279.25, then Minuscule 4 will have moved below the start of Minuscule 1, breaking the rule cited above.
Should that rule be broken under the present count, then the count must be revised as follows: The July 7 peak at 4353.25 becomes the end of wave 5 of Minuscule degree, and also the end of the rise that began June 20. The July 5 high of 4348 becomes the end of wave 3, and the June 6 low of 4305.25 becomes the end of wave 4.
The end of Minuscule wave 5 also means the end of parent 5th waves up to Minute degree, and also, one more degree larger, the end of wave 3 of Minor degree, which began on February 23, 2020.
Learning and other resources. See the menu page Analytical Methods for a rundown on where to go for information on Elliott wave analysis.
By Tim Bovee, Portland, Oregon, July 8, 2021
Disclaimer
Tim Bovee, Private Trader tracks the analysis and trades of a private trader for his own accounts. Nothing in this blog constitutes a recommendation to buy or sell stocks, options or any other financial instrument. The only purpose of this blog is to provide education and entertainment.
No trader is ever 100 percent successful in his or her trades. Trading in the stock and option markets is risky and uncertain. Each trader must make trading decisions for his or her own account, and take responsibility for the consequences.
License
All content on Tim Bovee, Private Trader by Timothy K. Bovee is licensed under a Creative Commons Attribution-ShareAlike 4.0 International License.
Based on a work at www.timbovee.com.

Mr. Bovee,
Thank you for your analysis. I’ve been following the Dow and I was curious if today’s possible 4th wave move in the Dow moved beyond the start of the preceding 1st wave, which on this Index could be 34,250 ? The S&P 500 is still above your call of dropping below 4,269.25 and I’m curious if the Dow has violated the rule and if so what thoughts you may have if in fact the two indexes are disparate.
David
LikeLike
The Dow peaked on May 10, ending it’s rise from the early pandemic low. It would analyze differently. (Although I don’t routinely do the Dow.)
LikeLike
[…] yesterday’s analysis for a discussion of why the 4269.25 level is […]
LikeLike