3:30 p.m. New York time
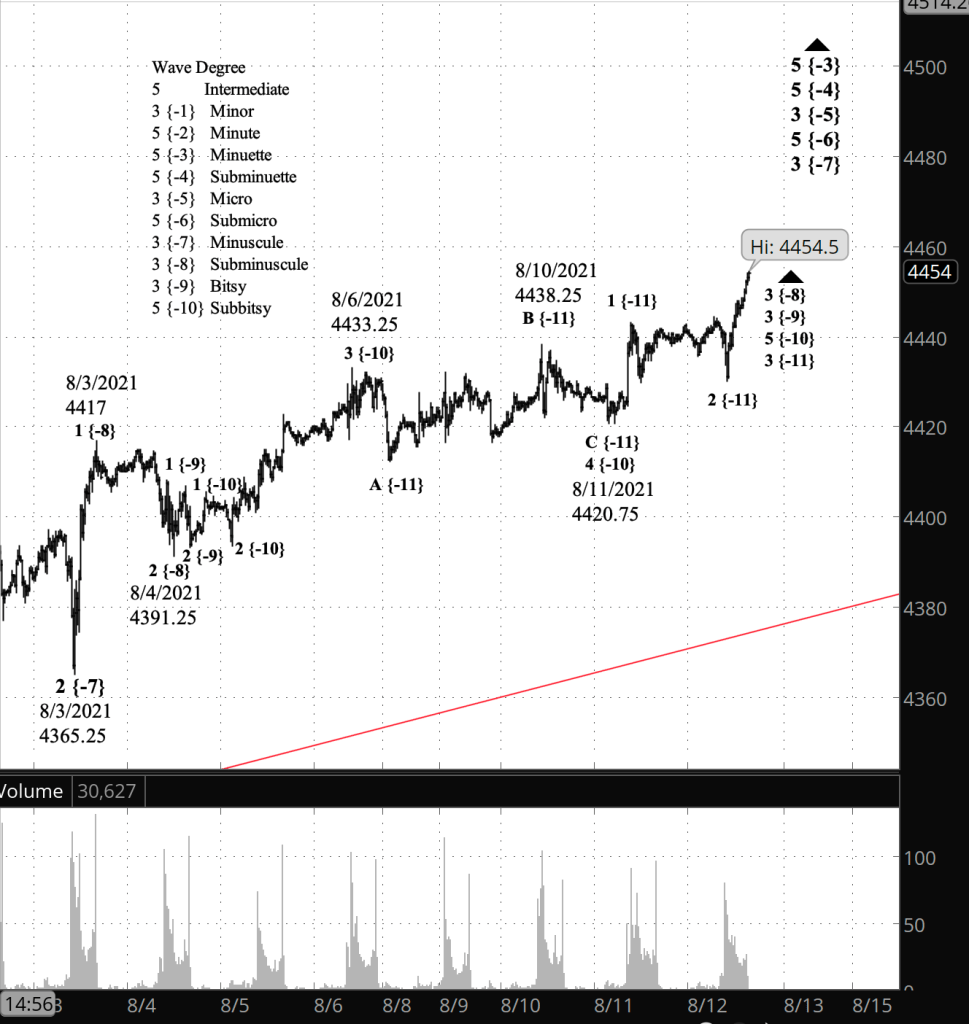
Half an hour before the closing bell. The S&P 500 rose to new heights in what is the middle leg of a low-degree uptrend that began with yesterday’s price reversal. The E-mini futures had reached 4454.50 so far, and the index, 4460.41.
In Elliott wave analysis nomenclature: The present low-degree uptrend is a 3rd wave within wave 5 of Subbitsy degree within wave 3 of Bitsy degree within wave 3 of Subminuscule degree. From this structure, we can next expect a shallow correction within within wave 5 of Subbitsy degree, and then an upward push to completion of the parent wave, Bitsy degree 3. At that higher level, what comes next is a shallow wave 4 correction of Bitsy degree, and then a push higher.
More succinctly. We’re going to have a series of climbs and corrections as the S&P 500 works its way up toward completion of 3rd and 5th waves of increasingly greater degree. This all neatly illustrates the fractal nature of market movements.
“WAIT A BIT, TYEK,” FARAD’N SAID. “THERE ARE WHEELS WITHIN WHEELS HERE.”
—CHILDREN OF DUNE BY FRANK HERBERT (1976)
9:35 a.m. New York time
What’s happening now? The S&P 500 E-mini futures reached a new high, 4444.25, before the opening bell and then dropped back by five points. The index didn’t set a new high at opening; the peak remains at yesterday’s high, 4449.44.
What does it mean? The rise that began August 4 from 4391.25 continues. It is a small part of the end game of a far larger move that began on February 23, 2020 from 2191.86.
What’s the alternative? The new high, like the last one, can be seen as a marker that ties together two corrective patterns within this month’s rise, in a compound structure. I consider this to be the less likely scenario.
What does Elliott wave theory say? A very close-in view on the chart.
Under my principle analysis, the rise from August 4 is wave 5 of Bitsy degree within wave 3 of Subminuscule degree within wave 3 of Minuscule degree, which began July 19 from 4224. The entire structure is set within wave 3 of Minor degree, five degrees higher, which is the third leg of an expanding Diagonal Triangle, wave 5 of Intermediate degree, that began December 26, 2018.
Under my alternative analysis,
Learning and other resources. Elliott wave analysis provides context, not prophecy. As the 20th century semanticist Alfred Korzybski put it in his book Science and Sanity (1933), “The map is not the territory … The only usefulness of a map depends on similarity of structure between the empirical world and the map.” And I would add, we can judge that similarity of structure only after the fact.
See the menu page Analytical Methods for a rundown on where to go for information on Elliott wave analysis.
By Tim Bovee, Portland, Oregon, August 12, 2021
Disclaimer
Tim Bovee, Private Trader tracks the analysis and trades of a private trader for his own accounts. Nothing in this blog constitutes a recommendation to buy or sell stocks, options or any other financial instrument. The only purpose of this blog is to provide education and entertainment.
No trader is ever 100 percent successful in his or her trades. Trading in the stock and option markets is risky and uncertain. Each trader must make trading decisions for his or her own account, and take responsibility for the consequences.
License
All content on Tim Bovee, Private Trader by Timothy K. Bovee is licensed under a Creative Commons Attribution-ShareAlike 4.0 International License.
Based on a work at www.timbovee.com.

You must be logged in to post a comment.