3:30 p.m. New York time
Half an hour before the closing bell. The S&P 500 continued its zigging and zagging downward course, which by my principal analysis is the C wave within a correction, wave 4 of Subbitsy degree within an uptrending wave 5 of Bitsy degree. No change in the analysis. i’ve updated the chart, below.
9:35 a.m. New York time
What’s happening now? The S&P 500 E-mini futures rose slightly in overnight trading, remaining below Tuesday’s high of 4542.25 on the futures, 4537.36 on the index, and then began a decline.
What does it mean? The decline is the final leg of a shallow, low level correction that began on August 31. When it is done, the next movement will be a rise to new highs.
What’s the alternative? A rise above 4542.25 would mean that the correction had ended and the rise to new heights was underway.
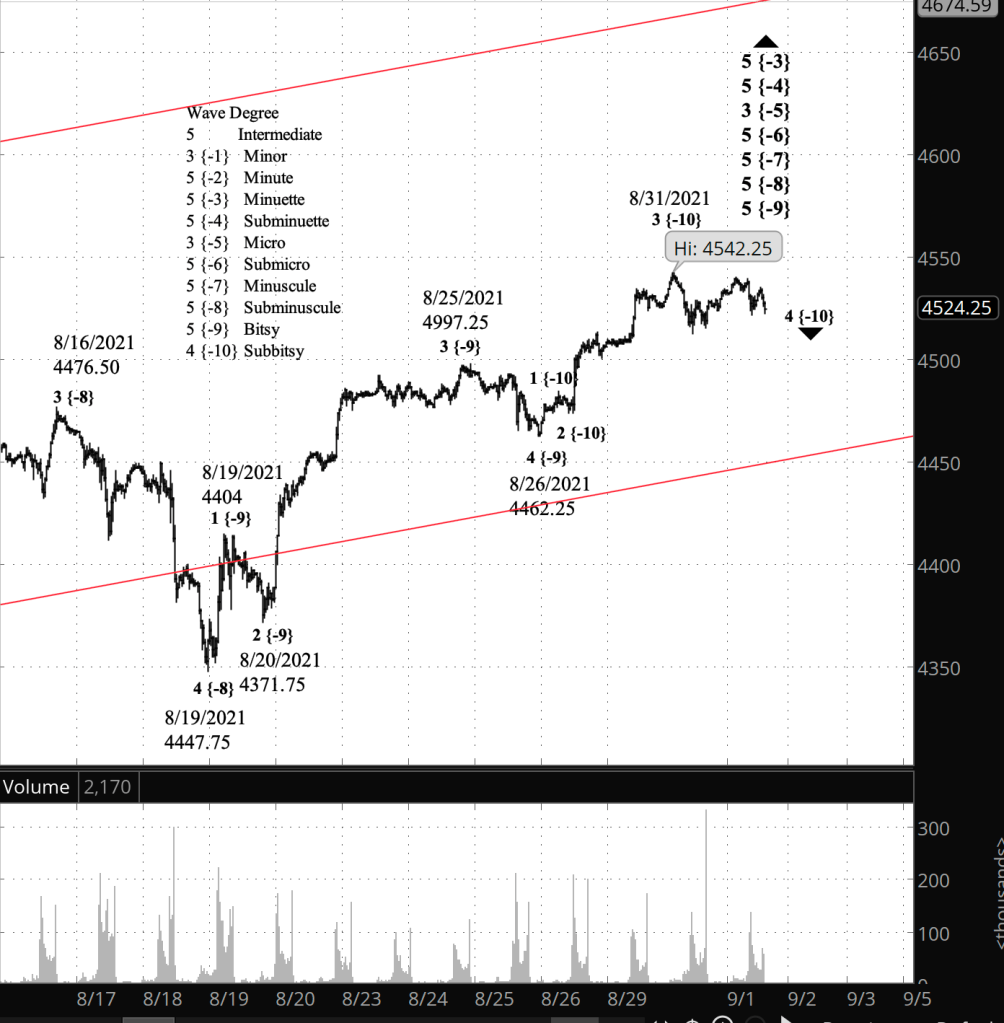
What does Elliott wave theory say? The decline from the August 31 high is wave 4 of Subbitsy degree. Within that parent wave, the A and B waves are complete, and wave C to the downside is underway.
When wave C is complete, there are two options: Either the price will reverse as wave 5 of Subbitsy degree and move above the prior peak of 4542.25, or there will be an upward separator X wave within Subbitsy wave 4 that will remain below that peak. It will be followed by a second corrective pattern in a compound structure.
The end of Subbitsy wave 5 will cascade up four levels, also ending 5th waves at Bitsy, Subminuscule, Minuscule and Submicro degrees, which in turn will mark the end of wave 3 of Micro degree, an uptrend that began last May. Micro 3 will be followed by a 4th wave correction and then a push to new heights.
Learning and other resources. Elliott wave analysis provides context, not prophecy. As the 20th century semanticist Alfred Korzybski put it in his book Science and Sanity (1933), “The map is not the territory … The only usefulness of a map depends on similarity of structure between the empirical world and the map.” And I would add, we can judge that similarity of structure only after the fact.
See the menu page Analytical Methods for a rundown on where to go for information on Elliott wave analysis.
By Tim Bovee, Portland, Oregon, September 1, 2021
Disclaimer
Tim Bovee, Private Trader tracks the analysis and trades of a private trader for his own accounts. Nothing in this blog constitutes a recommendation to buy or sell stocks, options or any other financial instrument. The only purpose of this blog is to provide education and entertainment.
No trader is ever 100 percent successful in his or her trades. Trading in the stock and option markets is risky and uncertain. Each trader must make trading decisions for his or her own account, and take responsibility for the consequences.
License
All content on Tim Bovee, Private Trader by Timothy K. Bovee is licensed under a Creative Commons Attribution-ShareAlike 4.0 International License.
Based on a work at www.timbovee.com.

You must be logged in to post a comment.