3:30 p.m. New York time
Half an hour before the closing bell. The S&P 500 fell from the peak attained by the futures in overnight trading and then resumed the rise. In my revised principal Elliott wave analysis, I’ve counted the wave 3 correction of Subminuscule degree as still being underway. The decline from the overnight peak had five waves, which is too many for a complete correction. So the new high is either an expanding triangle pattern within the 4th wave correction or a continuation of wave 3 of Subminuscule degree. I’ve opted for the continuation of wave 3, which is plausible, given the internal count of that wave.
9:35 a.m. New York time
What’s happening now? The S&P 500 E-mini futures in overnight trading completed their rise that began on October 13 and began a shallow correction.
What does it mean? The correction will be followed by a push higher that will complete the first leg of the rise that began on October 1 and will be followed buy a sharp move to the downside that will remain above 4260.
What’s the alternative? The rise since October 1 could prove to be a separator, marking the boundary between two corrective patterns within a compound structure.
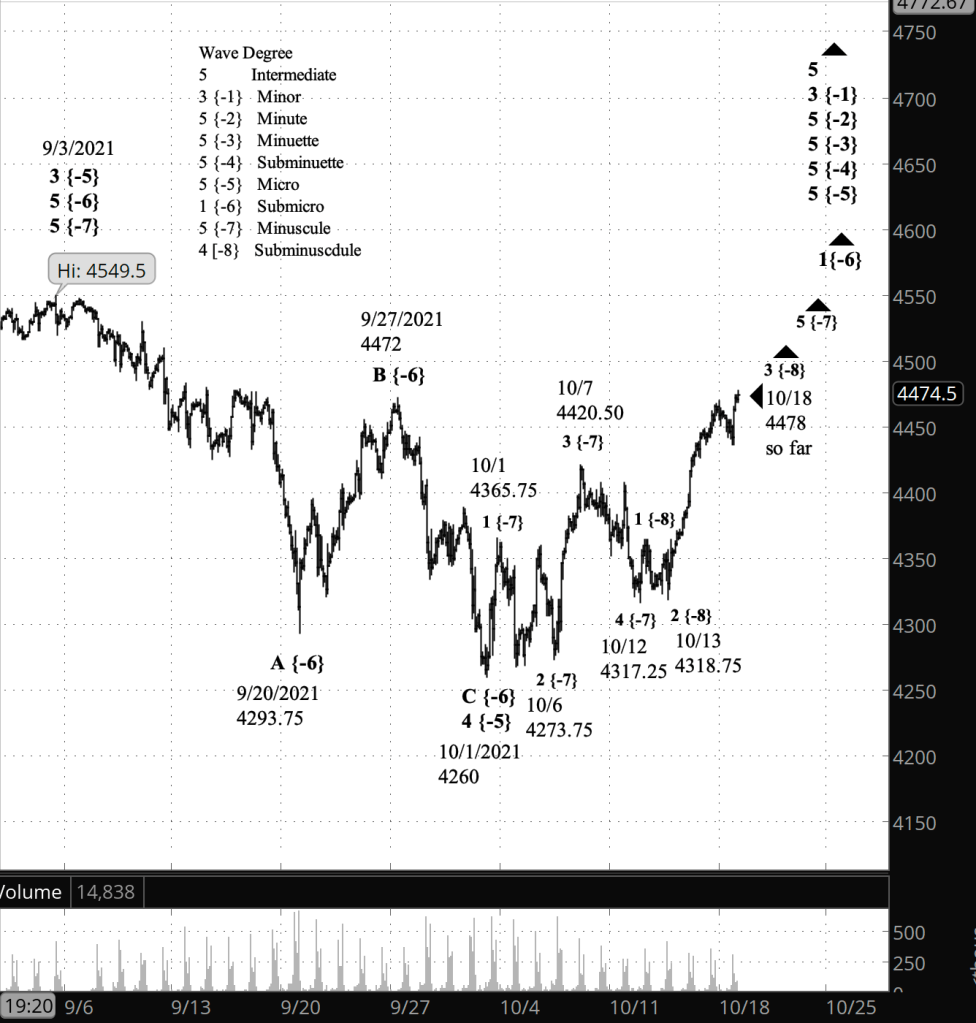
What does Elliott wave theory say? The overnight peak at 4469.50 marked the end of wave 3 of Subminuscule degree and the beginning of a shallow 4th-wave correction, all within wave 5 of Minuscule degree. The end of Minuscule 5 will trigger the simultaneous end of wave 1 of Submicro degree, which began October 1 from 4260. The ensuing wave 2 of Submicro degree, if it follows the pattern of most 2nd waves I’ve seen, will retrace much of the 1st-wave rise from October 1. Under the rules of Elliott wave analysis, 2nd waves never move beyond the start of the preceding 1st wave, and so the price will remain above the October 1 low of 4260.
The alternative is unchanged from the last few days: The rise from October 1 is an X wave of Submicro degree separating two corrective patterns in a compound correction. Such compound corrections are common in 4th waves, which matches the nature of the parent, wave 4 of Micro degree, which began September 3.
Learning and other resources. Elliott wave analysis provides context, not prophecy. As the 20th century semanticist Alfred Korzybski put it in his book Science and Sanity (1933), “The map is not the territory … The only usefulness of a map depends on similarity of structure between the empirical world and the map.” And I would add, we can judge that similarity of structure only after the fact.
See the menu page Analytical Methods for a rundown on where to go for information on Elliott wave analysis.
By Tim Bovee, Portland, Oregon, October 18, 2021
Disclaimer
Tim Bovee, Private Trader tracks the analysis and trades of a private trader for his own accounts. Nothing in this blog constitutes a recommendation to buy or sell stocks, options or any other financial instrument. The only purpose of this blog is to provide education and entertainment.
No trader is ever 100 percent successful in his or her trades. Trading in the stock and option markets is risky and uncertain. Each trader must make trading decisions for his or her own account, and take responsibility for the consequences.
License
All content on Tim Bovee, Private Trader by Timothy K. Bovee is licensed under a Creative Commons Attribution-ShareAlike 4.0 International License.
Based on a work at www.timbovee.com.

You must be logged in to post a comment.