3:30 p.m. New York time
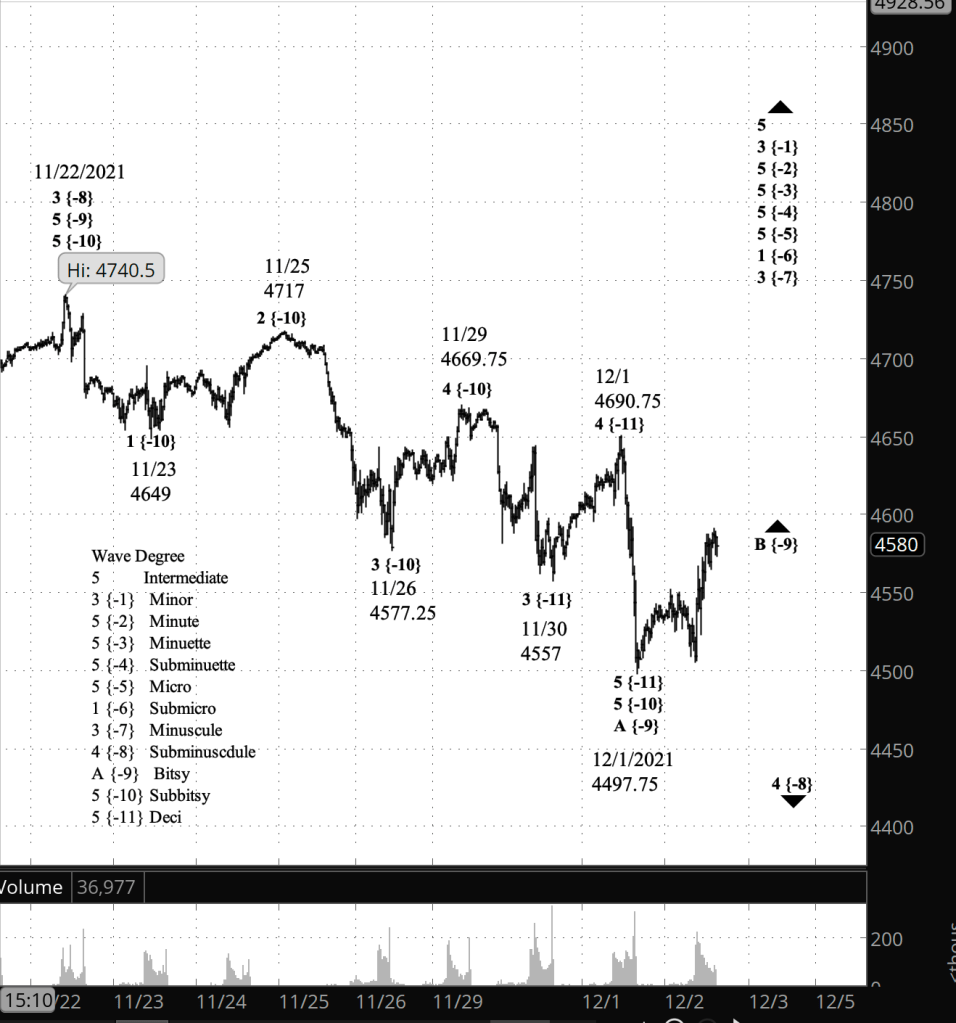
Half an hour before the closing bell. The futures continued to rise during the trading day in what appeared to be a three-wave pattern. Under my principal analysis, the decline to 4497.75 on December 1 completed wave A of Bitsy degree — subscript {-9} — and Bitsy wave B has begun, all within wave 4 of Subminuscule degree {-8}.
Under the alternative analysis, the reversal point ended wave 3 of Subbitsy degree and Subbitsy wave 4 has begun, all within Bitsy wave A within Subminuscule wave 4. The Subminuscule 4th wave correction will trade a Flat corrective pattern if its typical, and that brings us right back to the B-wave problem discussed Wednesday and Tuesday.
A reminder of the Elliott wave rule and tendency governing B waves in a Flat: The B wave must retrace at least 90% of the preceding A wave, and it usually will retrace 100% to 138% of the A wave.
If the chart in coming days adheres to those standards at the Bitsy degree level, then the principal analysis is correct. If it reverses and moves lower, then the alternative analysis is correct.
I’ve added an additional chart for late in the session, leaving this morning’s early in the session chart unchanged.
9:35 a.m. New York time
What’s happening now? The S&P 500 E-mini futures fell sharply beginning yesterday afternoon and continuing overnight, halting the decline and rising slightly as the opening bell approached.
What does it mean? I’ve reworked my principal analysis to accommodate the Elliott wave rule violation discussed in yesterday’s post. The details are low confidence. The key take-away is that the first leg of a downward correction of the rise that began October 6 is nearing completion and will be followed by a second leg to the upside. More details in the Elliott wave theory section below.
What’s the alternative? The decline from yesterday can be seen as the middle wave of the correction’s first leg, rather than the final leg as I have it. If the alternative is correct, there will be a low-level upward correction, followed by a further declne.
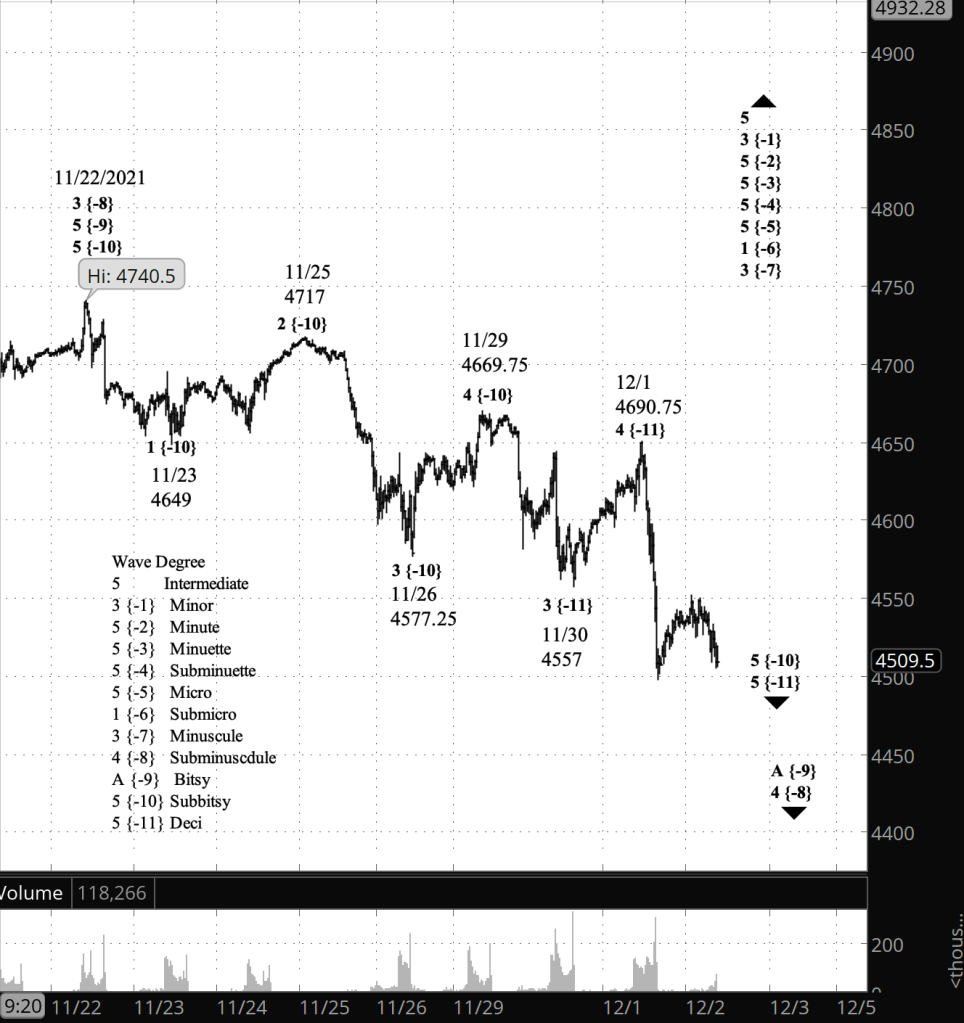
What does Elliott wave theory say? The two prior posts — December 1 and November 30 — focused on the B-wave problem. My principal analysis on those days showed a 4th wave falling quite short of a 90% retracement of the preceding A wave, such a retracement being a requirement for B waves in a Flat pattern, according to Elliott wave theory.
My reworking of the analysis gets rid of the problem in the usual Elliott wave fashion, by relabelling some waves as being of a lower degree. There are other approaches, but I’ve chosen this one because it seems closest to the “normal” look-and-feel of the structure.
Under the new principal analysis, the price is in wave 5 of Deci degree — subscript {-11} — within wave 5 of Subbitsy degree {-10} within wave A of Bitsy degree {-9} within wave 4 of Subminuscule degree {-8}, the last and largest wave in the series being a downward correction of wave 4 of Subminuscule degree, which began on October 6 from 4273.75 and ended on November 22 at 4740.50.
The alternative analysis reworks the count in such a way that the decline that began yesterday is wave 3 of Subbitsy degree. Doing it that way creates an overly large wave 1 of Subbitsy degree, in my opinion, and the proper look-and-feel — an aesthetic judgment of the waves — is a component of Elliott wave analysis.
Learning and other resources. Elliott wave analysis provides context, not prophecy. As the 20th century semanticist Alfred Korzybski put it in his book Science and Sanity (1933), “The map is not the territory … The only usefulness of a map depends on similarity of structure between the empirical world and the map.” And I would add, in the ever-changing markets, we can judge that similarity of structure only after the fact.
See the menu page Analytical Methods for a rundown on where to go for information on Elliott wave analysis.
By Tim Bovee, Portland, Oregon, December 2, 2021
Disclaimer
Tim Bovee, Private Trader tracks the analysis and trades of a private trader for his own accounts. Nothing in this blog constitutes a recommendation to buy or sell stocks, options or any other financial instrument. The only purpose of this blog is to provide education and entertainment.
No trader is ever 100 percent successful in his or her trades. Trading in the stock and option markets is risky and uncertain. Each trader must make trading decisions for his or her own account, and take responsibility for the consequences.
License
All content on Tim Bovee, Private Trader by Timothy K. Bovee is licensed under a Creative Commons Attribution-ShareAlike 4.0 International License.
Based on a work at www.timbovee.com.

You must be logged in to post a comment.