3:30 p.m. New York time
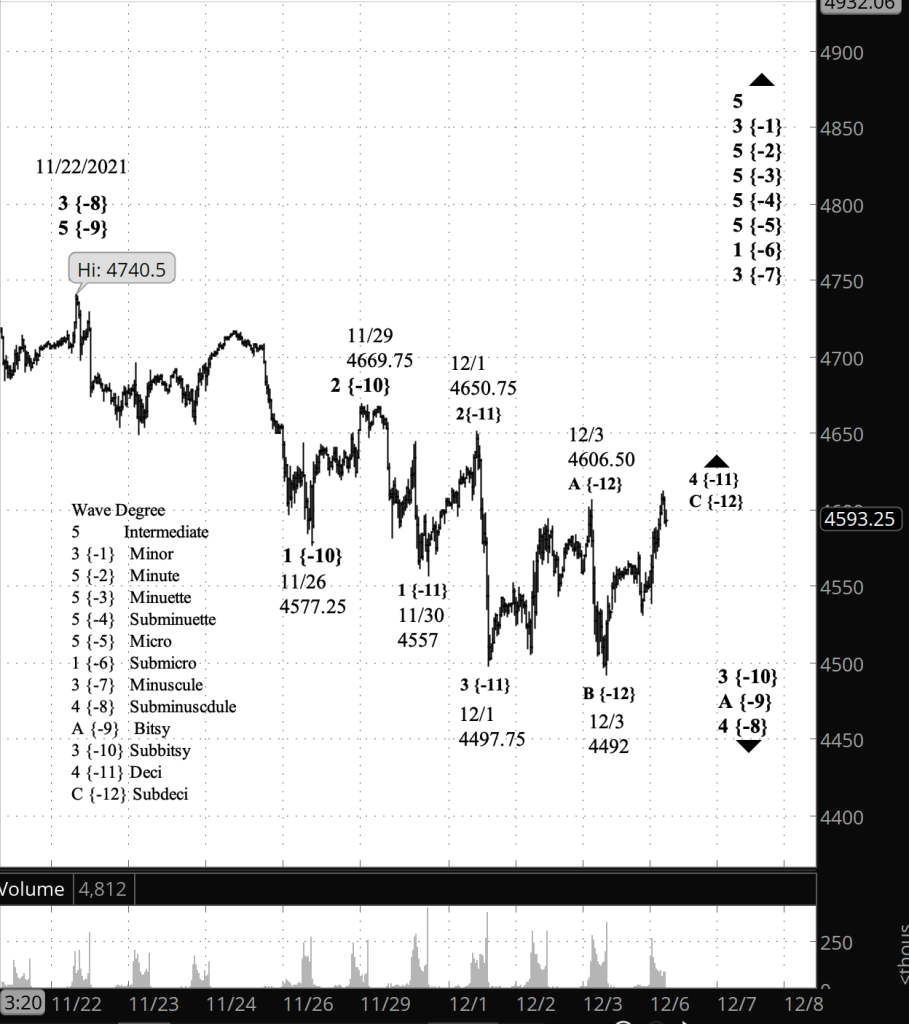
Half an hour before the closing bell. The rise from the December 3 low has exceeded that day’s earlier high, confirming that the 4th wave correction of Subbitsy degree is still underway. Today’s rise is wave C within the 4th wave. By exceeding the beginning of the preceding wave A, it confirmed that the pattern of the correction is a Flat.
The end of Deci wave C will also be the end of its parent, Subbitsy wave 4 and will be followed by a 5th wave decline, most likely below the end of wave 3, 4497.75.
The relabeling of the 4th wave means that wave 3 of Subbitsy degree ended on December 1 at 4497.75.
There are a number of wheels within wheels on this chart. The smallest wheel is an upward final corrective subwave of Deci degree (C wave) in the direction of a larger upward correction of Subbitsy degree (4th wave). They are embraced by a downtrending first corrective subwave, of Bitsy degree (A wave), which in turn lies within a larger downward correction of Subminuscule degree (4th wave). So it’s a Russian matryoshka nesting doll filled with corrective waves. The biggest doll, containing all the smaller dolls, is a rising impulse wave of Minuscule degree (3rd wave), which began on October 4, 2021.
That’s the new principal analysis. The new alternative analysis has to do with what comes next. Fourth waves especially are prone to extensions, compound corrections that glue two or three corrective patterns together. If wave 4 of Subbitsy degree develops into a compound correction, the present wave C will be followed by a downtrending X wave and then by the A wave of the corrective pattern, which could be a Flat, a Zigzag or a Triangle of some sort.
I’ve left this morning’s chart in place for comparison and added in this new chart reflecting the revised analysis.
9:35 a.m. New York time
What’s happening now? The S&P 500 E-mini futures turned downward after trading resumed Sunday evening. The rise from Friday’s low, 4492, peaked in the early morning hours today at 4570, declined slightly, and then rose at the opening bell, remaining below the earlier peak.
What does it mean? The rise is an upward correction within the decline that began December 3 from 4606.50. The present shape of the chart presents an ambiguity: Either the correction is over and the downtrend has resumed, or the rising first leg of the correction is over, to be followed by a downward move back toward Friday’s low and then another upward movement that will carry the price closer to the 4606.50 mark, the start of the decline.
I consider both to be of nearly equal probability. A decline below 4492 would mean the correction is over, and a new rise beginning above 4492 to a higher point within the correction would argue that the correction is still underway.
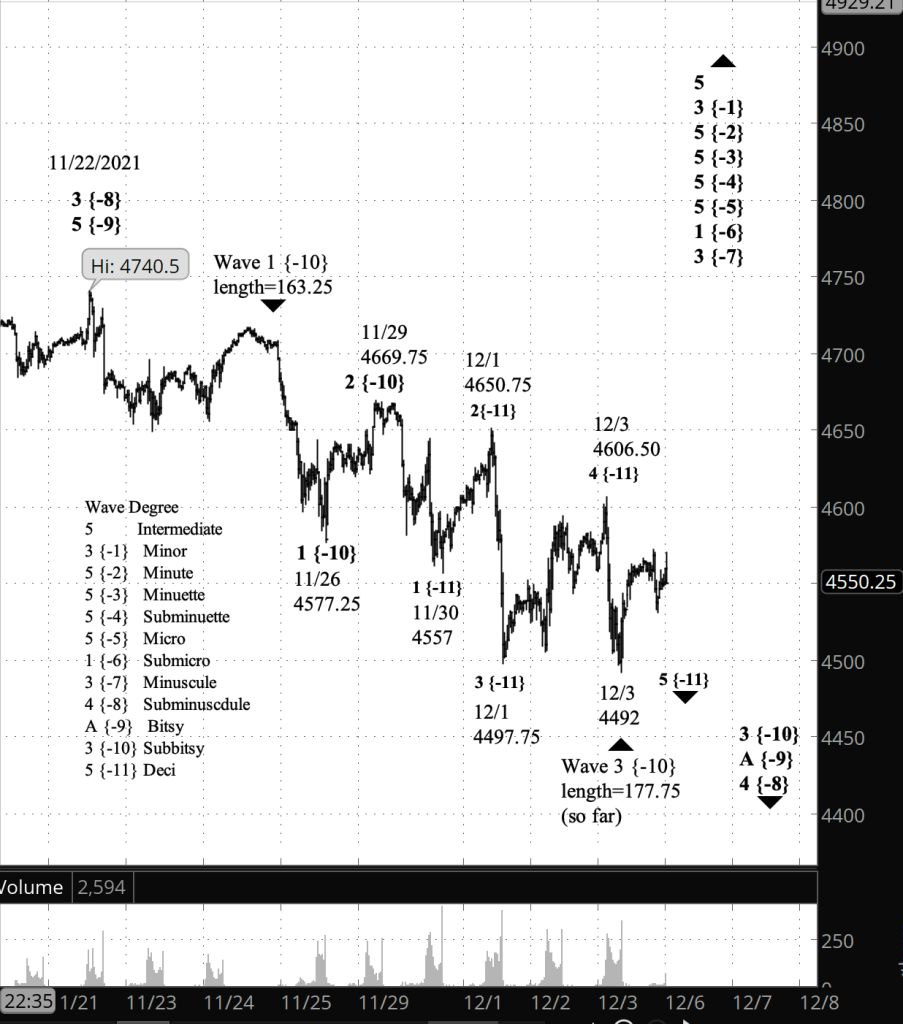
What does Elliott wave theory say? Both alternatives are looking within the decline that began on December 3, wave 5 of Deci degree — subscript {-11}. That downtrending impulse wave is in turn within wave 3 of Subbitsy degree {-10} within wave A of Bitsy degree {-9} within a wave 4 correction of Subminuette degree {-8}.
Wave 4 corrections tend to take the Flat pattern, and in a Flat, the A wave has three subwaves. So the end of wave 5 of Deci degree will mark the end of wave 3 of Subbitsy degree, which in turn will be the end of the parent wave A wave. The subsequent B wave also has three internal waves, and the final C wave has five waves internally.
If the correction is over, then the overnight peak was the end of wave C of Subdeci degree {-12}, and if the correction is still underway, then the peak ended wave A of Subdeci degree.
One thing that has bothered me about the chart since the decline that began on November 22 is that the first wave of the downward movement, wave 1 of Subbitsy degree, is larger than I normally see in 1st waves. A long 1st wave increases the risk that a firm rule of Elliott wave analysis will be violated. The rule is: Wave 3 cannot be shorter than both wave 1 and wave 5.
Wave 3 as of the December 3 low was longer than wave 1 — 177.75 vs. 163.25 — removing that concern as the chart develops.
Learning and other resources. Elliott wave analysis provides context, not prophecy. As the 20th century semanticist Alfred Korzybski put it in his book Science and Sanity (1933), “The map is not the territory … The only usefulness of a map depends on similarity of structure between the empirical world and the map.” And I would add, in the ever-changing markets, we can judge that similarity of structure only after the fact.
See the menu page Analytical Methods for a rundown on where to go for information on Elliott wave analysis.
By Tim Bovee, Portland, Oregon, December 6, 2021
Disclaimer
Tim Bovee, Private Trader tracks the analysis and trades of a private trader for his own accounts. Nothing in this blog constitutes a recommendation to buy or sell stocks, options or any other financial instrument. The only purpose of this blog is to provide education and entertainment.
No trader is ever 100 percent successful in his or her trades. Trading in the stock and option markets is risky and uncertain. Each trader must make trading decisions for his or her own account, and take responsibility for the consequences.
License
All content on Tim Bovee, Private Trader by Timothy K. Bovee is licensed under a Creative Commons Attribution-ShareAlike 4.0 International License.
Based on a work at www.timbovee.com.

You must be logged in to post a comment.