3:30 p.m. New York time
Half an hour before the closing bell. The S&P 500 moved below its prior low of the overnight session, to 4666.50 so far. The lower the the price goes, the high likelihood that the high of December 8, 4712, marked the end of the upward corrective pattern that began on December 1. No change in the analysis. I’ve updated the chart.
9:35 a.m. New York time
What’s happening now? The S&P 500 E-mini futures declined in overnight trading, reaching a low of 34.5 points below yesterday’s high.
What does it mean? The upward movement that began on December 3 — the final leg of the correction that began two days earlier — is still underway. I expect it to make a final push to the upside that will remain below the November 22 high of 4740.50. That final push will be followed by a decline that reaches below the start of the correction, 4497.75, continuing the downtrend that began on November 22.
What’s the alternative? Two points carry alternative analyses. First, the high of December 8 could possibly be the end of the correction. Secondly, the corrective pattern, when complete, could be followed by a downward movement that will remain above 4497.75, and then a second corrective pattern in a compound structure.
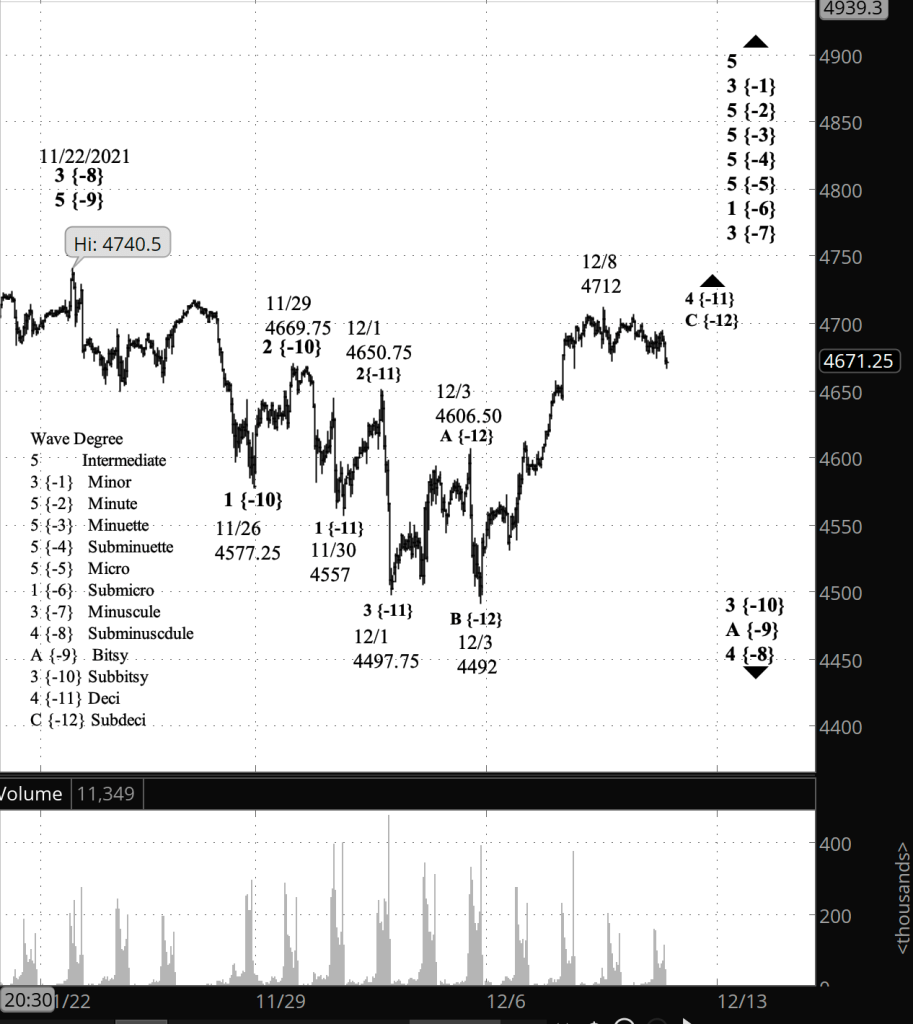
What does Elliott wave theory say? Under my principal analysis, the price presently in wave C of Subdeci degree — subscript {-12} — within wave 4 of Deci degree {-11}, which is an upward correction within declining wave 3 of of Subbitsy degree {-10} within wave A of Bitsy degree {-9} within wave 4 of Subminuscule degree {-8}, which began on October 6.
Under the first alternative analysis, wave C of Subdeci degree and its parent 4th wave ended with the December 8 peak, and wave 5 of Deci degree is in the early stages of its decline.
Under the second alternative analysis, wave C of Subdeci degree is still under — the same as in the principal analysis. It will be followed by an X wave to the downside and then a second corrective pattern, usually another Flat or perhaps a Zigzag.
Learning and other resources. Elliott wave analysis provides context, not prophecy. As the 20th century semanticist Alfred Korzybski put it in his book Science and Sanity (1933), “The map is not the territory … The only usefulness of a map depends on similarity of structure between the empirical world and the map.” And I would add, in the ever-changing markets, we can judge that similarity of structure only after the fact.
See the menu page Analytical Methods for a rundown on where to go for information on Elliott wave analysis.
By Tim Bovee, Portland, Oregon, December 9, 2021
Disclaimer
Tim Bovee, Private Trader tracks the analysis and trades of a private trader for his own accounts. Nothing in this blog constitutes a recommendation to buy or sell stocks, options or any other financial instrument. The only purpose of this blog is to provide education and entertainment.
No trader is ever 100 percent successful in his or her trades. Trading in the stock and option markets is risky and uncertain. Each trader must make trading decisions for his or her own account, and take responsibility for the consequences.
License
All content on Tim Bovee, Private Trader by Timothy K. Bovee is licensed under a Creative Commons Attribution-ShareAlike 4.0 International License.
Based on a work at www.timbovee.com.

You must be logged in to post a comment.