3:30 p.m. New York time
Half an hour before the closing bell. The S&P 500, before the opening bell, pushed past a Fibonacci 61.8% retracement of the 2nd wave downward correction that began on December 16. Thereafter, the 3rd wave rise dawdled throughout the session, staying within a range about $7 wide on the futures. No change in the analysis. I’ve updated the chart.
9:35 a.m. New York time
What’s happening now? The S&P 500 E-mini futures in overnight trading paused at a 50% retracement of the downward correction from December 16 to December 20.
What does it mean? The rise from December 20 is a resumption of the uptrend and will eventually rise above the December 12 high, 4743.25, perhaps significantly above that level.
What’s the alternative? If the price reverses back to the downside without reaching a new peak, then the correction is still underway. Under this scenario, the low of December 20 marked the end of the first leg of the correction, not of the entire correction.
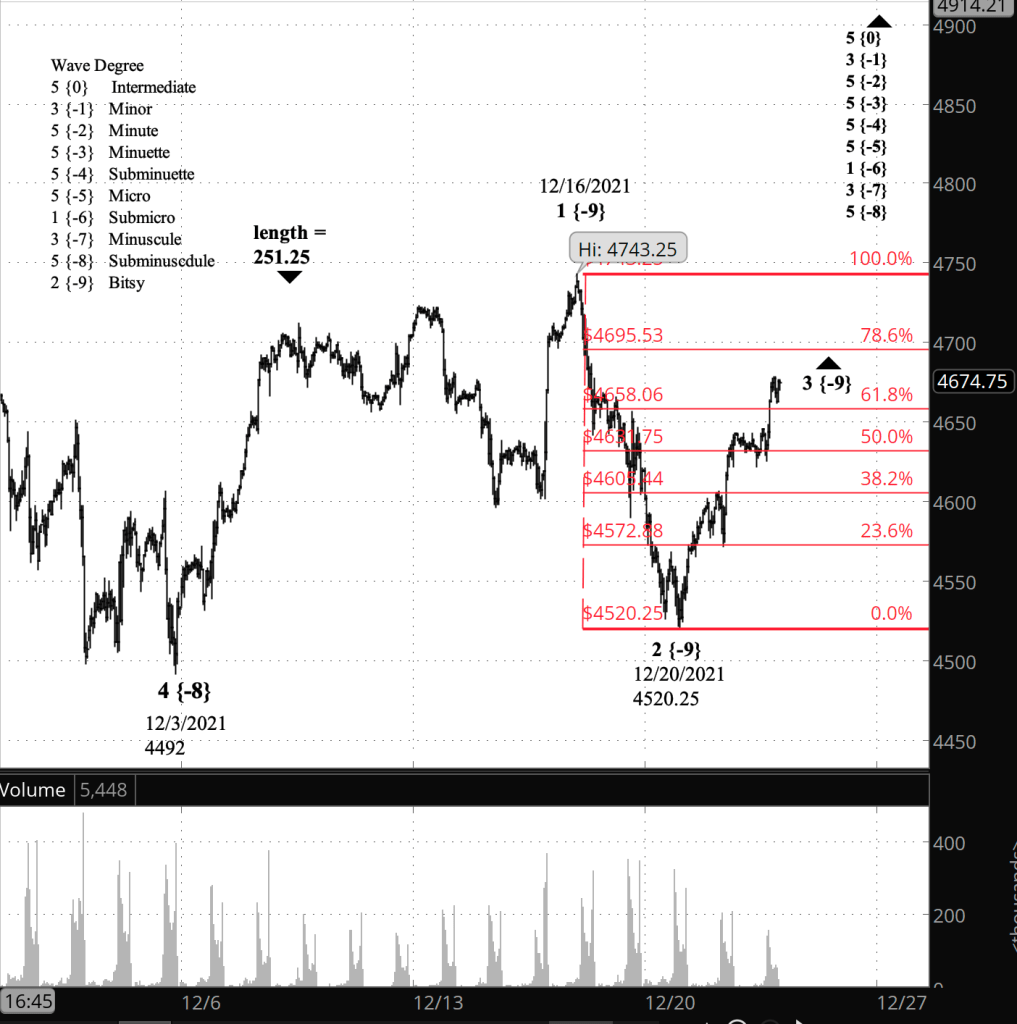
What does Elliott wave theory say? Under my principal analysis, the rise from December 20 is wave 3 of Bitsy degree — subscript {-9} — within uptrending wave 5 of Subminuscule degree {-8}. A 3rd wave typically is the longest of the three waves, out of five, that move in the direction of a trend, and under the rules of Elliott wave analysis, it cannot be the shortest of the three, non-corrective waves.
Wave 1 of Bitsy degree came in with a length of 251.25. The present wave 3 shortly before the opening bell had reached a length of 125.75. So to avoid being shorter than wave 1, the 3rd wave will need to reach, at a minimum, a price of 4771.50.
Of course, Bitsy wave 3 will be followed by a 4th wave and then a 5th. If that 5th wave turns out to be the shortest of the three movements in the direction of the trend, then the Ellliott rules allow wave 3 to be shorter than wave 1.
The end of the parent wave 5 of Subminuscule degree will also mark the end of wave 3 of Minuscule degree {-7}, which will be followed by a 4th wave correction, most likely tracing a Flat pattern.
Learning and other resources. Elliott wave analysis provides context, not prophecy. As the 20th century semanticist Alfred Korzybski put it this way in his book Science and Sanity (1933), “The map is not the territory … The only usefulness of a map depends on similarity of structure between the empirical world and the map.” And I would add, in the ever-changing markets, we can judge that similarity of structure only after the fact.
See the menu page Analytical Methods for a rundown on where to go for information on Elliott wave analysis.
By Tim Bovee, Portland, Oregon, December 22, 2021
Disclaimer
Tim Bovee, Private Trader tracks the analysis and trades of a private trader for his own accounts. Nothing in this blog constitutes a recommendation to buy or sell stocks, options or any other financial instrument. The only purpose of this blog is to provide education and entertainment.
No trader is ever 100 percent successful in his or her trades. Trading in the stock and option markets is risky and uncertain. Each trader must make trading decisions for his or her own account, and take responsibility for the consequences.
License
All content on Tim Bovee, Private Trader by Timothy K. Bovee is licensed under a Creative Commons Attribution-ShareAlike 4.0 International License.
Based on a work at www.timbovee.com.

You must be logged in to post a comment.