3:30 p.m. New York time
Half an hour before the closing bell. The S&P 500 rose during the trading session, reaching a peak of 4776 on the futures and 4784.72 on the index. Wave 3 of Bitsy degree continues its rise. The exchange-traded fund SPY, which tracks the index, also reached a new peak today.
The achievement of new highest highs by all three instruments resolves a discrepancy that has been on the charts since December 16. Both the futures and SPY track the index, but the correlation is never perfect and from time to time that truth becomes glaringly obvious.
The futures hit a new peak of December 16. But the index and SPY did not; their highest peaks were achieved on November 22 and remained the highest thereafter. Today’s upward push brought all three instruments to new peaks, resolving the discrepancy.
I’ve updated the futures chart below. No change in the analysis.
2:55 p.m. New York time
Private Trader Changes. I’ve posted a rundown of a couple of changes I shall be making to this daily post beginning the first Monday of the New Year, January 3.
9:55 a.m. New York time
New peak. The S&P 500 futures moved above the 4743.25, the all-time peak set on December 16, confirming that the 3rd wave uptrend of Bitsy degree {-9} is underway. The new all-time high, which is unlikely to survive for long, is 4746.75. The principal analysis is correct; the alternative, scrapped. I’ve updated the chart.
9:35 a.m. New York time
What’s happening now? The S&P 500 E-mini futures rose when trading resumed after the long holiday weekend, reaching a level 2 points below the all-time peak of 4743.25 set on December 16.
What does it mean? The rise that began December 20 from 4520.25 is the middle leg of a larger uptrend that began December 3 from 4492. I expect the rise to break above the prior high, 4743.25, to a new peak, perhaps even today.
What’s the alternative? If the price reverses downward without breaking above the December 16 peak, then the downward correction that began December 16 is still underway and is in its middle leg. The downward movement will be followed by another rise that will remain below 4743.25.
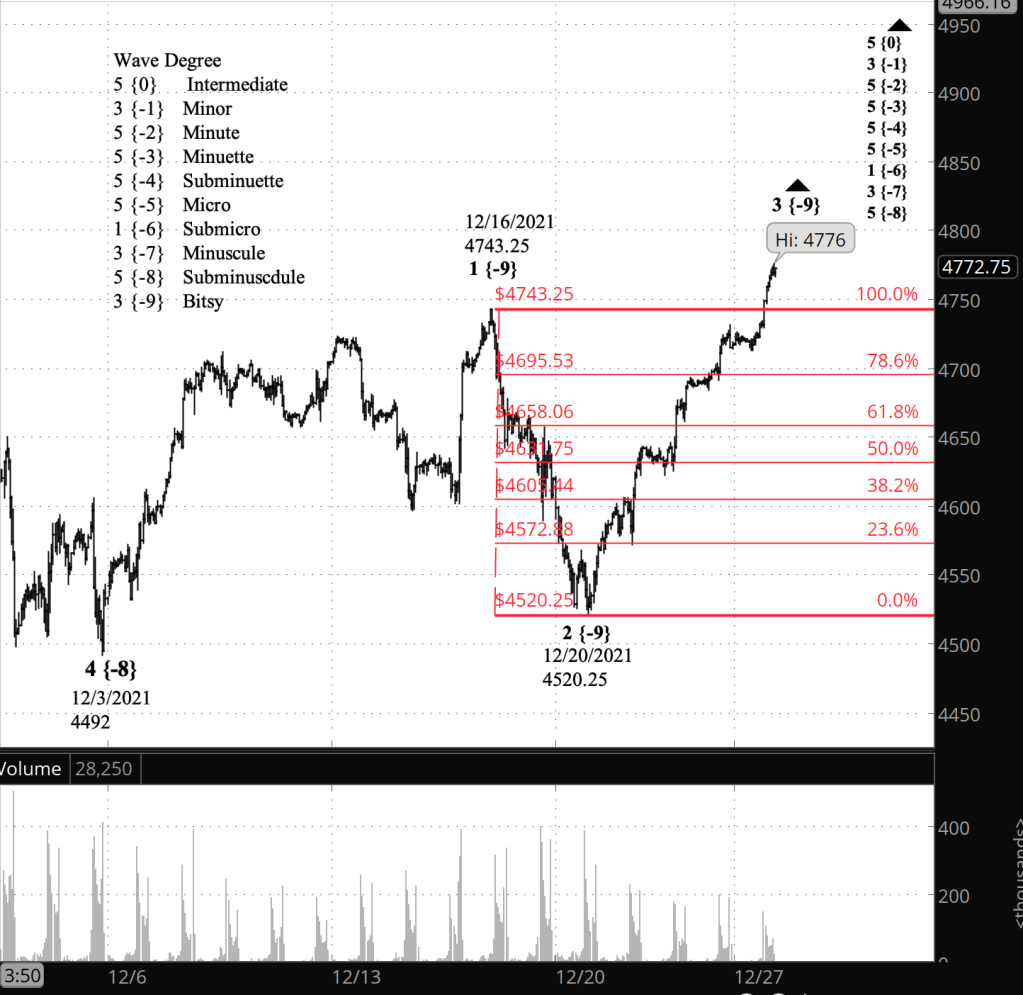
What does Elliott wave theory say? Under my principal analysis, the present rise is wave 3 of Bitsy degree — subscript {-9} — within uptrending wave 5 of Subminuscule degree {-8}. The December 16 all-time high marked the end of wave 1 of Bitsy degree. Second waves ALWAYS move beyond the start of the preceding 1st wave, so it’s only a matter of time, perhaps only hours, before it happens. It if fails to move beyond the end of wave 1, then it isn’t a 3rd wave and the alternative analysis is correct.
Under my alternative analysis, the decline that ended on December 20 was wave A of Subbitsy degree {-10} and the present rise that now underway is Subbitsy wave B, both subwaves of a correction, wave 2 of Bitsy degree. Most corrections are composed of three subwaves, so the falling wave that followed Subbitsy B will when complete mark the end of wave 2 of Bitsy degree. Second waves NEVER move beyond the end of the preceding wave 1. If it does move beyond that point, then it isn’t a 2nd wave and the principal analysis is correct.
Learning and other resources. Elliott wave analysis provides context, not prophecy. As the 20th century semanticist Alfred Korzybski put it this way in his book Science and Sanity (1933), “The map is not the territory … The only usefulness of a map depends on similarity of structure between the empirical world and the map.” And I would add, in the ever-changing markets, we can judge that similarity of structure only after the fact.
See the menu page Analytical Methods for a rundown on where to go for information on Elliott wave analysis.
By Tim Bovee, Portland, Oregon, December 27, 2021
Disclaimer
Tim Bovee, Private Trader tracks the analysis and trades of a private trader for his own accounts. Nothing in this blog constitutes a recommendation to buy or sell stocks, options or any other financial instrument. The only purpose of this blog is to provide education and entertainment.
No trader is ever 100 percent successful in his or her trades. Trading in the stock and option markets is risky and uncertain. Each trader must make trading decisions for his or her own account, and take responsibility for the consequences.
License
All content on Tim Bovee, Private Trader by Timothy K. Bovee is licensed under a Creative Commons Attribution-ShareAlike 4.0 International License.
Based on a work at www.timbovee.com.

You must be logged in to post a comment.