3:30 p.m. New York time
Half an hour before the closing bell. The S&P 500 peaked this morning and then began a slow decline. I’ve adjusted my principal analysis to show wave 3 of Deci degree {-11} ending at that peak, 4798 on the futures and 4807.02 on the index. The present wave is a 4th wave correction of Deci degree within uptrending wave 3 of Subbitsy degree. Otherwise, this morning’s analysis stands. I’ve updated the chart.
9:35 a.m. New York time
What’s happening now? The S&P 500 E-mini futures continued to rise in overnight trading, reaching 4797.25.
What does it mean? My principal analysis concludes that the rise from December 20 is in its final leg internally. When that last leg ends, the S&P 500 will enter a downward correction before resuming its upward course.
What’s the alternative? The final leg of a trend has no limit to how far it can travel, beyond a certain tendency to be of more or less of the same magnitude as other portions of the structure. So, yes, a correction lies ahead after the last leg reaches completion. And, no, it won’t necessarily be in the next few days, although it could be. As is often the case with stock market charts, ambiguity rules the day.
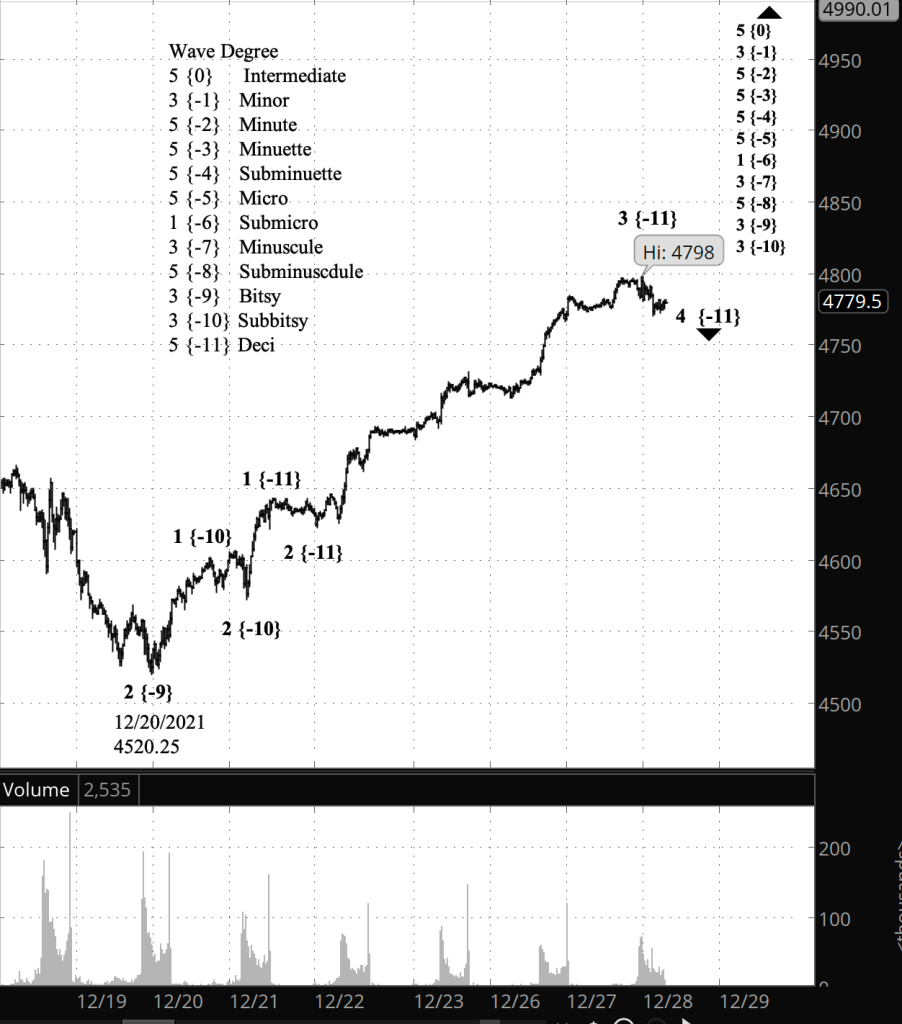
What does Elliott wave theory say? The rise from December 20 is wave 3 of Bitsy degree — subscript {-9} — and within it wave 3 of Subbitsy degree {-10} is underway. Further down the fractal structure, wave 5 of Deci degree {-11} began yesterday. When Deci wave 5 is complete, its parent wave 3 of Subbitsy degree will also be complete, ushering in a 4th wave correction. Subbitsy wave 4 will be followed by a 5th wave, which has no limits on how far it can go, but also no requirement that it travel any great distance.
The end of Subbitsy 5 will also be the end of Bitsy wave 3, which will mark the start of a 4th wave correction. Bitsy 4 will be followed by a 5th wave whose end will complete the rise from December 20, and also mark the completion the parent, wave 5 of Subminuscule degree {-8}.
When Subminuscule 5 reaches its end, it will also mark the end of its parent, wave 3 of Minuscule degree {-7} and the beginning of a noticeably large correction.
The analysis applies to both my principal and alternative analyses. The only unknown is the timing of the coming 4th wave corrections.
Calendar notes. No earnings plays in sight this week. The next trading opportunities will be on Wednesday, January 5. The next earnings kicks off the week of January 18, when AA publishes its earnings. For options trades not associated with events, the optimal entry window for options expiring February 22 is on Tuesday, January 4, and I’ll be looking for trades on that date.
Learning and other resources. Elliott wave analysis provides context, not prophecy. As the 20th century semanticist Alfred Korzybski put it this way in his book Science and Sanity (1933), “The map is not the territory … The only usefulness of a map depends on similarity of structure between the empirical world and the map.” And I would add, in the ever-changing markets, we can judge that similarity of structure only after the fact.
See the menu page Analytical Methods for a rundown on where to go for information on Elliott wave analysis.
By Tim Bovee, Portland, Oregon, December 28, 2021
Disclaimer
Tim Bovee, Private Trader tracks the analysis and trades of a private trader for his own accounts. Nothing in this blog constitutes a recommendation to buy or sell stocks, options or any other financial instrument. The only purpose of this blog is to provide education and entertainment.
No trader is ever 100 percent successful in his or her trades. Trading in the stock and option markets is risky and uncertain. Each trader must make trading decisions for his or her own account, and take responsibility for the consequences.
License
All content on Tim Bovee, Private Trader by Timothy K. Bovee is licensed under a Creative Commons Attribution-ShareAlike 4.0 International License.
Based on a work at www.timbovee.com.

You must be logged in to post a comment.