3:30 p.m. New York time
Half an hour before the closing bell. Unless something dramatic happens in the next half hour, the stock markets are ending 2021, not with a bang, but whimper. Analysis unchanged. I’ve updated the chart.
“This is the way the world ends. This is the way the world ends. This is the way the world ends. Not with a bang but a whimper.” –T.S. Elliott, “The Hollow Men” (poem) (1925)
9:35 a.m. New York time
Private Trader: Changes ahead. Beginning Monday, the first day of the new year, I’ll be making a couple of changes to Private Trader. One will be the title of this daily post, from “SP500 Analysis” to “Trader’s Notebook”, reflecting the broader range of material I’ll be covering. A second change will be that I shall no longer use the traditional degree names when writing about my Elliott wave analysis of the markets, but will use the wave number and a subscript in curly brackets, same as I do on the charts. So rather than writing “wave 5 of Subminuscule degree {-8}”, I’ll simplify it to “wave 5 {-8}”. On Monday I posted a discussion of the changes.
What’s happening now? The S&P 500 E-mini futures dropped by more than 40 points shortly before the closing bell on Thursday, and then began a sideways movement similar to that of the three days prior, albeit at a lower level.
What does it mean? The decline casts doubt on my labeling of yesterday’s peak as meaning that the correction was over. Under my principal analysis today, the uptrend preceding the correction ended at yesterday’s peak; the correction began from that point and is still underway.
What’s the alternative? No clear alternative at this point. Although the chart, with its holiday season flatness, lacks clarity.
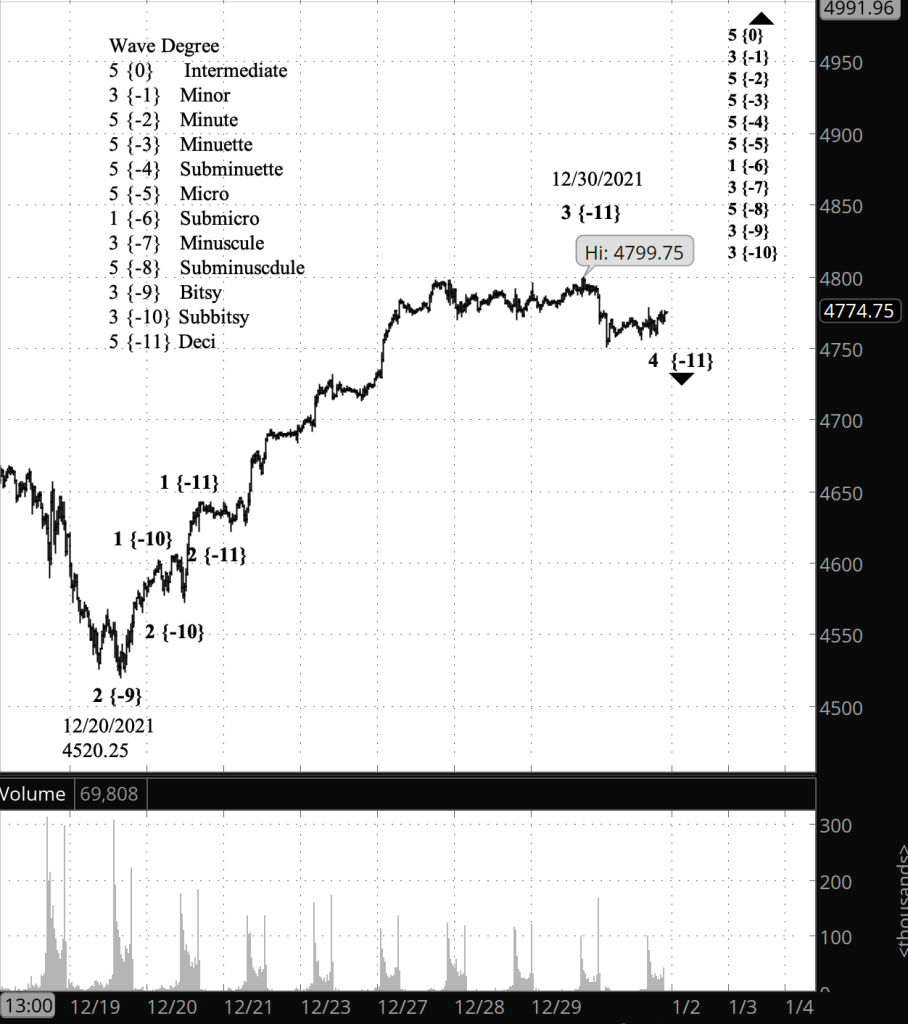
What does Elliott wave theory say? Under my principal analysis, wave 4 of Deci degree — subscript {-11} — is continuing its course, which has largely been sideways. It is a downward correction within a series of ever larger uptrending movements: Wave 3 of Subbitsy degree {-10} within wave 3 of Bitsy degree {-9} within wave 5 of Subminuscule degree {-8}.
On the chart I moved the end of wave 3 of Deci degree to the December 30 peak of 4799.75, and the decline that followed is wave 4 of Deci degree.
Learning and other resources. Elliott wave analysis provides context, not prophecy. As the 20th century semanticist Alfred Korzybski put it this way in his book Science and Sanity (1933), “The map is not the territory … The only usefulness of a map depends on similarity of structure between the empirical world and the map.” And I would add, in the ever-changing markets, we can judge that similarity of structure only after the fact.
See the menu page Analytical Methods for a rundown on where to go for information on Elliott wave analysis.
By Tim Bovee, Portland, Oregon, December 31, 2021
Disclaimer
Tim Bovee, Private Trader tracks the analysis and trades of a private trader for his own accounts. Nothing in this blog constitutes a recommendation to buy or sell stocks, options or any other financial instrument. The only purpose of this blog is to provide education and entertainment.
No trader is ever 100 percent successful in his or her trades. Trading in the stock and option markets is risky and uncertain. Each trader must make trading decisions for his or her own account, and take responsibility for the consequences.
License
All content on Tim Bovee, Private Trader by Timothy K. Bovee is licensed under a Creative Commons Attribution-ShareAlike 4.0 International License.
Based on a work at www.timbovee.com.

You must be logged in to post a comment.