3:30 p.m. New York time
Half an hour before the closing bell. After re-touching the 23.6% Fibonacci retracement level on Wednesday, the S&P 500 futures declined in today’s session, dropping back to the 50% retracement. The magnitude of the fall has persuaded me that the January 12 high, 4739.50, marks the end of wave B{-10} — with three subwaves — and that wave C{-10} is now underway. Under the rules of the Elliott wave analysis, C{-10} will have five subwaves. The chart is also consistent with the second alternative discussed this morning (see below). Under that scenario, the rise to January 12 was a 2nd wave correction within a downtrend that began on January 4, and downtrending wave 3 has now begun. If the price declines below the end of wave 1 at 4572.75 — the decline from January 4 — then the second alternative is correct. If the price remains above that level, and then reverses to reach above the January 4 high, 4808.25, then the principal analysis is correct. I’ve updated the chart.
1:20 p.m. New York time
My trades. Trading opportunities are becoming more plentiful as earnings season kicks off. Today was heavy on the financials, and I entered two options positions and one shares position.
The options positions were on C and WFC, both structured as iron condors. The implied volatility was a bit lower than I like, but the positions as built have good risk/reward ratios and sufficiently high premium in relation to the width between the short and long options. The long shares position was on FRC, which isn’t liquid enough to meet my standards for options trading. All three companies publish earnings on Friday before the opening bell. I’ve posted full analysis for the options plays, C and WFC.
9:35 a.m. New York time
What’s happening now? The S&P 500 E-mini futures rose by a bit more than 30 points in overnight trading, remaining below yesterday’s high, 4739.50.
What does it mean? The second, rising leg of a downward correction that began on January 4 is still underway.
What are the alternatives? The correction ended on January 10, and a new uptrend is underway and will rise above the present all-time high of 2808.25, attained on January 4.
Another alternative: The January 4 high was the beginning of a downtrend that will fall below the December 3 low, 4492, and the rise from January 10 is an upward correction within that downtrend.
Chart. Late due to a problem with my almost-brand-new Macbook, fixed by a restart.
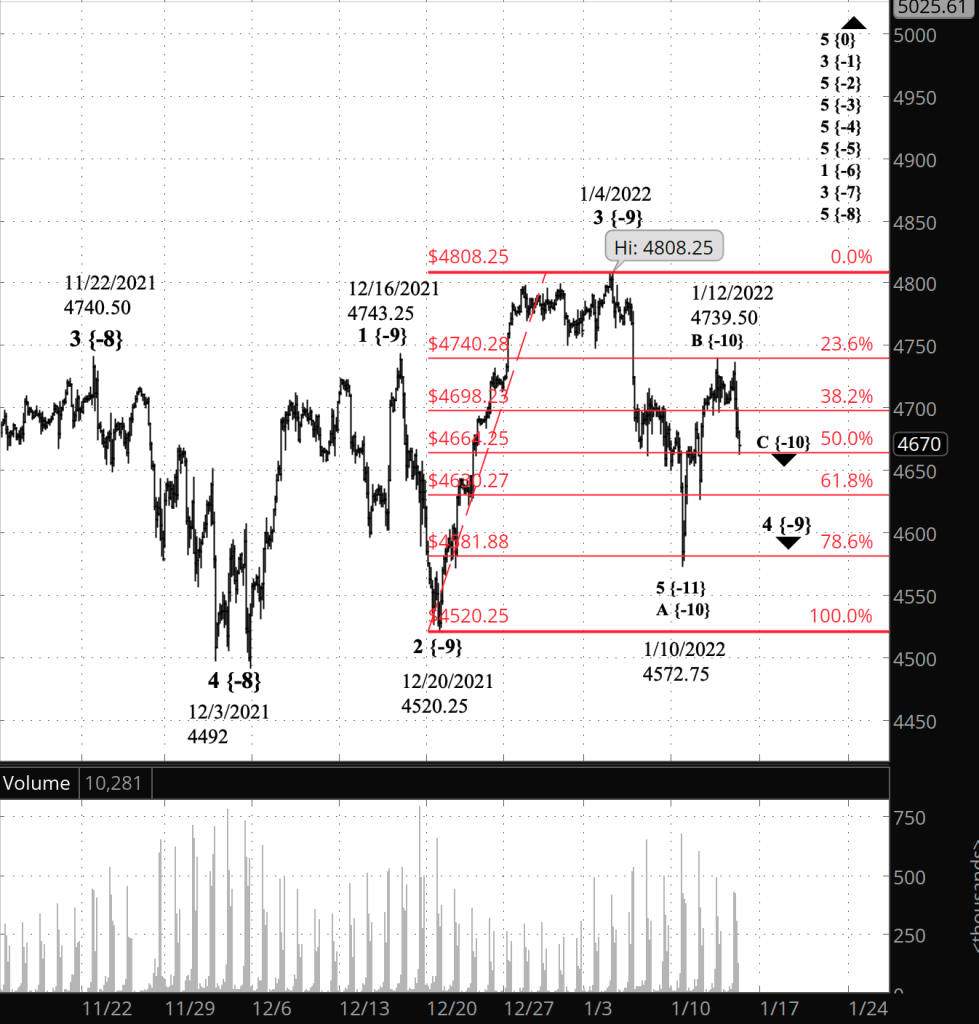
What does Elliott wave theory say? Under my principal analysis, the rise from January 10 is wave B{-10} within a downward correction, wave 4{-9}. The preceding A wave had five waves internally, meaning that the correction is likely to take the Zigzag form. Under the rules the B wave must have three waves. The third internal wave ended at yesterday’s high point, and the subsequent sideways movement suggests the possibility that wave B is adding on another push higher — a 5th wave following a 4th wave internal correction. Five internal waves would break the rules for B waves, and so the rise would have to recounted as something else.
For example, the alternatives for the rise from January 10 go like this:
1) It’s wave 5{-9} following wave 4{-9}, a downward correction that ended on January 10, and will exceed the January 4 high, 4808.25.
2) It’s a wave 2{-10} correction within a new downtrend, wave 1{-9}, that began on January 4, which under this scenario would be labelled as the end of wave 5{-9} rather than as a 3rd wave.
If the rise from January 10 has five waves internally, it invalidates the principal analysis, but not the alternatives. Under the first alternative, the rise from January 10 is a 1st wave — five waves internally — and under the second alternative, it is an A wave within a Zigzag pattern, with five waves internally.
Learning and other resources. Elliott wave analysis provides context, not prophecy. As the 20th century semanticist Alfred Korzybski put it this way in his book Science and Sanity (1933), “The map is not the territory … The only usefulness of a map depends on similarity of structure between the empirical world and the map.” And I would add, in the ever-changing markets, we can judge that similarity of structure only after the fact.
See the menu page Analytical Methods for a rundown on where to go for information on Elliott wave analysis.
By Tim Bovee, Portland, Oregon, January 13, 2022
Disclaimer
Tim Bovee, Private Trader tracks the analysis and trades of a private trader for his own accounts. Nothing in this blog constitutes a recommendation to buy or sell stocks, options or any other financial instrument. The only purpose of this blog is to provide education and entertainment.
No trader is ever 100 percent successful in his or her trades. Trading in the stock and option markets is risky and uncertain. Each trader must make trading decisions for his or her own account, and take responsibility for the consequences.
License
All content on Tim Bovee, Private Trader by Timothy K. Bovee is licensed under a Creative Commons Attribution-ShareAlike 4.0 International License.
Based on a work at www.timbovee.com.

You must be logged in to post a comment.