3:30 p.m. New York time
Half an hour before the closing bell. The S&P 500 futures continued to decline throughout the day, as wave C{-10} within wave 4{-9} fell below the end point of the previous wave A{-10}. No change in the analysis. I’ve updated the chart.
10:45 a.m. New York time
Another trade. I’ve entered a short iron condor earnings play on MS and have posted an analysis of the trade.
My trade. I’ve exited my short iron condor earnings play on LW for a 35.2% profit and have updated the analysis with full results.
9:35 a.m. New York time
What’s happening now? The S&P 500 E-mini futures fell in overnight trading, reaching 4590.25 so far.
What does it mean? The decline is the final leg of a downward correction that began on January 4 from 4808.25. It will be followed by a rise above that level to new heights.
What are the alternatives? There are two, the same as those outlined in detail in yesterday’s post. A third, that the low, 4606, attained on January 14 ended the downward correction (Alternative #2 in yesterday’s post), is no longer a valid alternative, since the price has dropped below that level.
The alternatives:
- A resumption of the downtrend that began on January 14, carrying the price below the December 20 low of 4520.25.
- A compound correction. The rise from January 10 to January 12 connects two corrective patterns. The first was the decline from January 4 to January 10, and the second began on January 12.
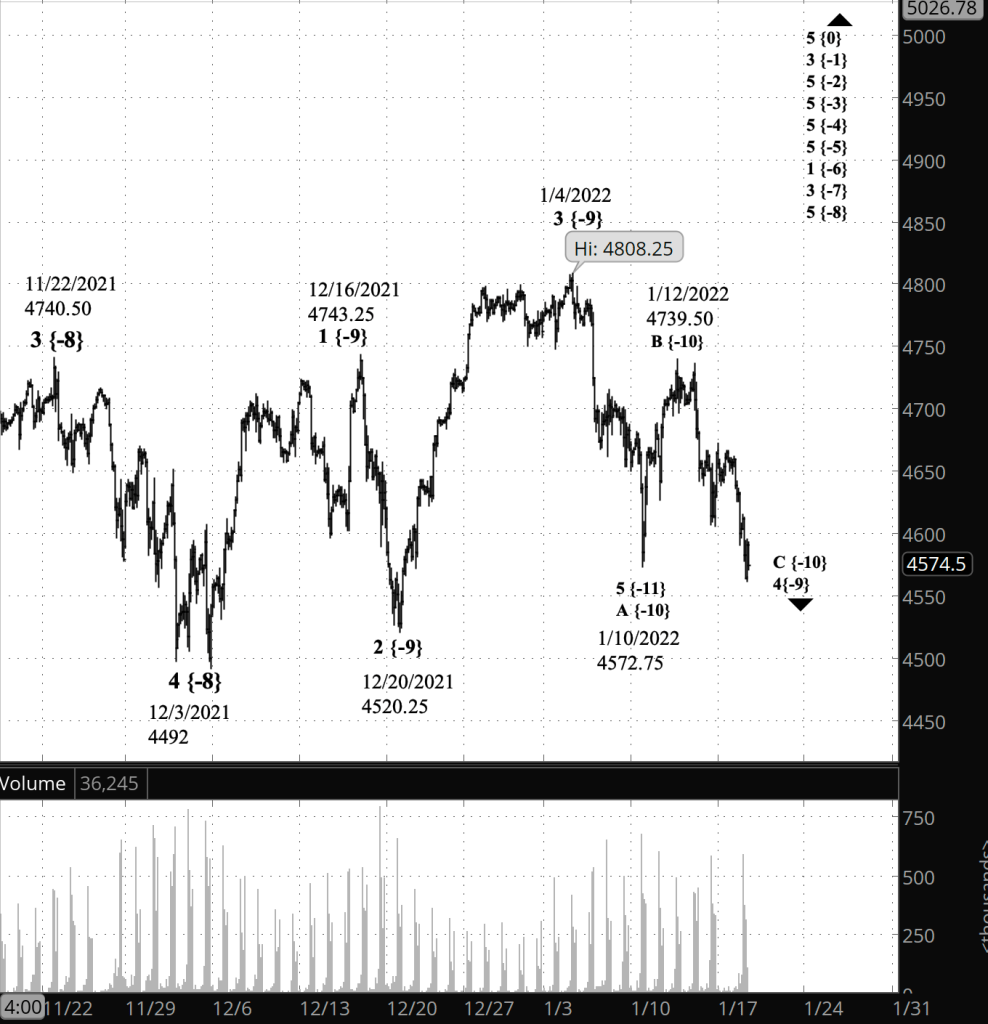
What does Elliott wave theory say? Under the principal analysis, within wave 4{-9}, wave C{-10}, which began on January 12, is still underway and is in its 5th wave internally.
Under the first alternative, within wave 1{-9}, wave 3{-10} began on January 12 following an upward correction, the first steps of a larger decline.
Under the second alternative, within wave 4{-9}, one downward corrective pattern ended on January 10, the connecting wave X{-10} ended on January 12, and the first wave of a second corrective pattern within wave 4{-9} is now underway.
Learning and other resources. Elliott wave analysis provides context, not prophecy. As the 20th century semanticist Alfred Korzybski put it this way in his book Science and Sanity (1933), “The map is not the territory … The only usefulness of a map depends on similarity of structure between the empirical world and the map.” And I would add, in the ever-changing markets, we can judge that similarity of structure only after the fact.
See the menu page Analytical Methods for a rundown on where to go for information on Elliott wave analysis.
By Tim Bovee, Portland, Oregon, January 18, 2022
Disclaimer
Tim Bovee, Private Trader tracks the analysis and trades of a private trader for his own accounts. Nothing in this blog constitutes a recommendation to buy or sell stocks, options or any other financial instrument. The only purpose of this blog is to provide education and entertainment.
No trader is ever 100 percent successful in his or her trades. Trading in the stock and option markets is risky and uncertain. Each trader must make trading decisions for his or her own account, and take responsibility for the consequences.
License
All content on Tim Bovee, Private Trader by Timothy K. Bovee is licensed under a Creative Commons Attribution-ShareAlike 4.0 International License.
Based on a work at www.timbovee.com.

You must be logged in to post a comment.