3:30 p.m. New York time
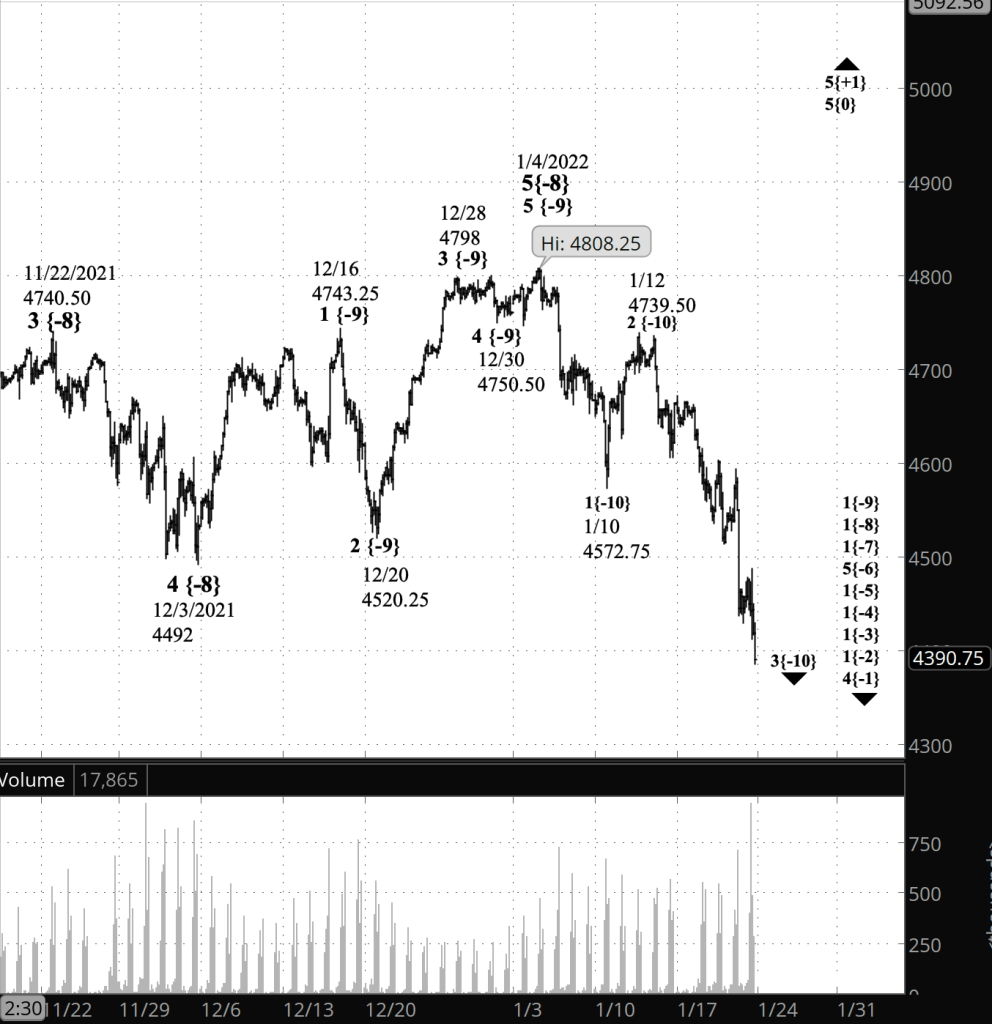
Half an hour before the closing bell. The S&P 500 continued to fall during the day, with the futures reaching the 4380s and the index, the 4390s. Downtrending wave 1{-9} continues. No change to the analysis. I’ve updated both charts.
What comes next? Wave 1{-9} is late in the 3rd or possibly 5th wave internally, meaning that the end is in site. When 1{-9} is complete, it will be followed by a 2nd wave correction that typically will retrace much of the prior 1st wave, perhaps reaching back into the 4700s. That upward correction will be followed by a powerful downtrending wave 3{-9}, which will be a strong signal to traders that the bull years may have come to an end. The ensuing wave 4{-9} will typically be a largely sideways correction, and then wave 5{-9} will decline still further, completing the parent wave 1{-8}. After that, wave 2{-9} again carries the prices upward, most likely higher than they are now, before an even more power wave 3{-8} brings things crashing down.
11:15 a.m. New York time
HAL earnings play entry. I’ve opened a short iron condor options position on HAL in anticipation of its earnings announcement on Monday before the opening bell. I’ve posted an analysis of the trade.
10:55 a.m. New York time
MU earnings play exit. I exited a short iron condor options position on MU that I entered last December in two parts. The first came near the end of December, to avoid assignment of the in-the-money calls when the stock went ex-dividend. I held on to the puts, in the form of a bull put spread, until the last trading day. The put options at the last moment gained some value, raising the certain prospect of assignment, and I exited. I’ve updated the analysis with results for the remaining bull put spread and for the iron condor as a whole.
9:35 a.m. New York time
What’s happening now? The S&P 500 E-mini futures fell to 4429.50 in overnight trading, reaching below the December 3 low of 4492.
What does it mean? The January 4 peak at 4808.25 ended an uptrend that began on September 30 from 4293.75 and a new downtrend has begun that will eventually reach 2000 and below.
What’s the alternative? The correction that began from the January 4 peak is still underway and will be followed by a rise to new heights, above 4808.25.
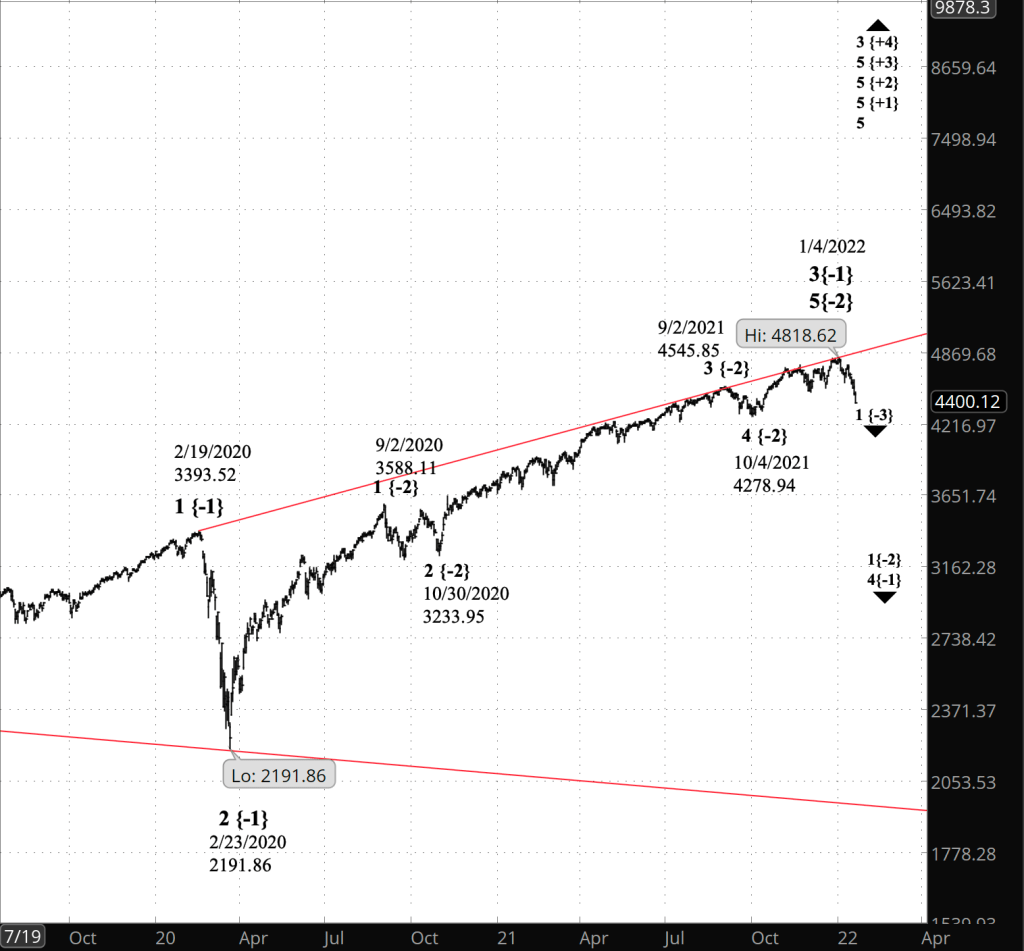
Charts. The upper chart is a near-term view of the S&P 500 futures, going back to mid-November 2021. The lower chart is a long-term view of the S&P 500 index, going back to mid-July 2019, showing the February 2020 crash early in the pandemic.
What does Elliott wave theory say? I’ve said written on several occasions that if the price moved below 4492, the start of wave 5{-8}, then I would take that as a strong signal that a new downtrend had begun. The move below 4492 in overnight trading demanded a new downtrend the principal analysis.
The secondary analysis is where we’ve been since January 4 — a 4th wave downward correction of the {-9} degree that was in its C wave and nearing its end. This still remains as a viable options because there’s no rule in Elliott that says that a 4th wave can’t move below the beginning of the preceding 1st wave. It seems inelegant, but there you go. Sometimes the markets present an odd aesthetic.
Under my principal analysis, the January 4 peak completed 5th wave cascading up from wave 5{-8}, which began on August 19, 2021, all the way to wave 5{-2}, which began October 4, 2021. The end of wave 5{-2} in turn marks the end of its parent, wave 3{-1}, which began on February 23, 2020 at the end of the early pandemic crash.
The red lines on the long-term chart mark the boundaries of an expanding Diagonal Triangle that began in December 2018. Wave 4{-1} will eventually reach the lower boundary of the triangle, which is presently in the 1960s. Since the triangle is expanding, the lower boundary will decline further each day and so will be noticeably lower by the time the market arrives at that boundary.
It will be an epic decline, and then it will reverse in Wave 5{-1}, which will carry the price back to the every rising upper boundary. At that point, the triangle will be complete, cascading up the fractal wave structure to wave 3{+4}, which began in the late 17th century, according to Robert Prechter‘s analysis. The ensuing wave 4{+4} decline will be of a magnitude no person alive today has ever seen.
Learning and other resources. Elliott wave analysis provides context, not prophecy. As the 20th century semanticist Alfred Korzybski put it this way in his book Science and Sanity (1933), “The map is not the territory … The only usefulness of a map depends on similarity of structure between the empirical world and the map.” And I would add, in the ever-changing markets, we can judge that similarity of structure only after the fact.
See the menu page Analytical Methods for a rundown on where to go for information on Elliott wave analysis.
By Tim Bovee, Portland, Oregon, January 21, 2022
Disclaimer
Tim Bovee, Private Trader tracks the analysis and trades of a private trader for his own accounts. Nothing in this blog constitutes a recommendation to buy or sell stocks, options or any other financial instrument. The only purpose of this blog is to provide education and entertainment.
No trader is ever 100 percent successful in his or her trades. Trading in the stock and option markets is risky and uncertain. Each trader must make trading decisions for his or her own account, and take responsibility for the consequences.
License
All content on Tim Bovee, Private Trader by Timothy K. Bovee is licensed under a Creative Commons Attribution-ShareAlike 4.0 International License.
Based on a work at www.timbovee.com.

You must be logged in to post a comment.