3:30 p.m. New York time
Half an hour before the closing bell. The S&P 500 fell sharply for the first three hours of the trading session, reaching a low of 4212.75 on the futures, 4222.62 on the index, and then reversed, climbing more than 120 points. The decline, wave 3{-10}, has met the requirements set forth in Elliott wave theory, and so the rise could be the first steps of wave 4{-10}. I’m leaving the chart marked as wave 3 underway, as I analyzed it this morning, and will defer declaring wave 4 to have begun until I see a bit more upside and some internal wave patterns to confirm it. I’ve updated the chart.
1:35 p.m. New York time
A note on share positions. Every share of stock that I own is underwater, and I plan to exit some of them in order to lower my losses. Based on my principal analysis of the S&P 500 chart, my plan is to wait for the 2nd wave, wave 2{-9} to carry price up toward the January 4 high and exit there. Wave wave 4{-10} should be starting its upward correction movement soon, and it it goes high enough, then I’ll exit as close as I can get to that wave’s endpoint.
1:30 p.m. New York time
GE bear call spread earnings play. I’ve entered a short bear call spread on GE timed to coincide with Tuesday’s earnings announcement before the opening bell, and have posted an analysis.
1:15 p.m. New York time
ACI short iron condor partial exit. The short put on my ACI iron condor was in-the-money the day before the stock goes ex-dividend, and that created a risk that the puts would be assigned, dumping short shares into my account. To avoid assignment, I’ve exited my ACI puts, leaving the calls in place as a short bear call spread. I’ve updated the analysis with results of the puts exit.
9:35 a.m. New York time
What’s happening now? The S&P 500 E-mini futures declined into the low 4300s in overnight trading.
What does it mean? The downtrend that began on January 4 from 4808.25 is still in its first leg and eventually has much further to fall, with the decline being interrupted, as is usual in the markets, by the occasional upward correction. The next correction might well retrace much of the decline but will remain below the January 4 high.
What’s the alternative? The decline from January 4 is an exceptionally robust downward correction within a long-running uptrend. When the correction ends, the price will reverse to the upside and eventually will reach news highs above 4808.25.
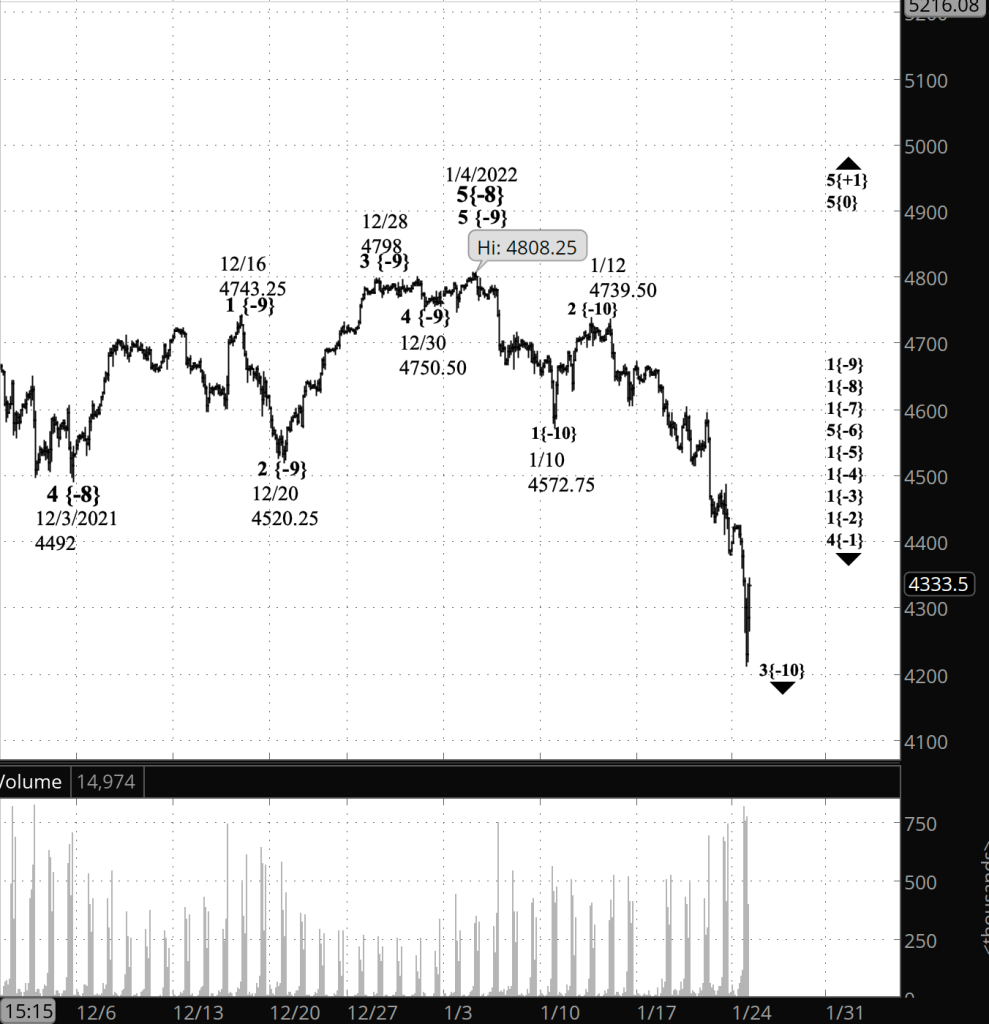
What does Elliott wave theory say? Under my principal analysis, which I consider to be by far the more likely scenario, the January 4 peak of wave 5{-8} has been followed by wave 1{-9} within wave 1{-8}. Internally, wave 1{-10} is in its 3rd wave, which reached 4311.50 before the opening bell.
Wave 1{-9} will be followed by an upward retracement, wave 2{-9}. Second waves often take back much of the previous decline and, typically, cause traders to question whether the downtrend is really underway. It’s a head-fake, and they become convinced of the downtrend only when the subsequent 3rd wave takes the prices still lower.
Under the alternative analysis, wave 5{-8} and larger 5th waves didn’t end on January 4, and the present decline is a downward correction that typically will consist of three waves.
The principal analysis will be proven wrong if the price breaks above 4808.25, the January 4 high. The alternative analysis will be proven wrong if the price remains below 4808.25 and reverses to lower lows.
Learning and other resources. Elliott wave analysis provides context, not prophecy. As the 20th century semanticist Alfred Korzybski put it this way in his book Science and Sanity (1933), “The map is not the territory … The only usefulness of a map depends on similarity of structure between the empirical world and the map.” And I would add, in the ever-changing markets, we can judge that similarity of structure only after the fact.
See the menu page Analytical Methods for a rundown on where to go for information on Elliott wave analysis.
By Tim Bovee, Portland, Oregon, January 24, 2022
Disclaimer
Tim Bovee, Private Trader tracks the analysis and trades of a private trader for his own accounts. Nothing in this blog constitutes a recommendation to buy or sell stocks, options or any other financial instrument. The only purpose of this blog is to provide education and entertainment.
No trader is ever 100 percent successful in his or her trades. Trading in the stock and option markets is risky and uncertain. Each trader must make trading decisions for his or her own account, and take responsibility for the consequences.
License
All content on Tim Bovee, Private Trader by Timothy K. Bovee is licensed under a Creative Commons Attribution-ShareAlike 4.0 International License.
Based on a work at www.timbovee.com.

You must be logged in to post a comment.